Figures & data
Table 1 Comparison of baseline characteristics in cases and controls
Table 2 Comparison of outcomes between intervention and control arms at 6 months
Figure 1 Randomization and follow-up of patients in intervention and control arms.
Abbreviations: COPD, chronic obstructive pulmonary disease; FEV1, forced expiratory volume in the first second; FVC, forced vital capacity; PaCO2, partial pressure of carbon dioxide in arterial blood; NPPV, noninvasive positive pressure ventilation.
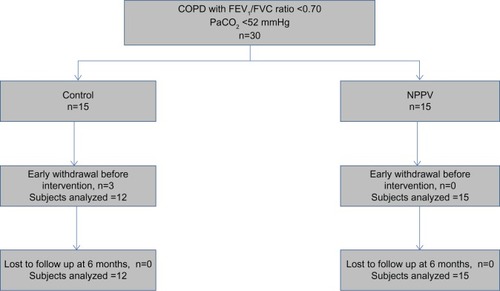
Figure 2 Change in dyspnea measured by TDI and quality of life (CRQ-Mastery domain) over time in intervention and control arms. Dots represent control arm; squares represent intervention arm.
Abbreviations: TDI, Transitional Dyspnea Index; CRQ, Chronic Respiratory Disease Questionnaire; NPPV, noninvasive positive pressure ventilation.
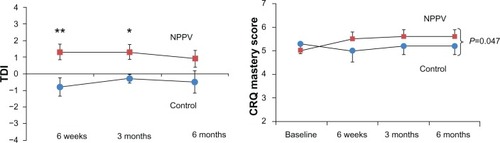
Table 3 Compliance with noninvasive positive pressure ventilation
Table 4 Side effects
Figure 3 Correlation between change in CRQ-Mastery domain and average numbers of hours of use of noninvasive positive pressure ventilation.
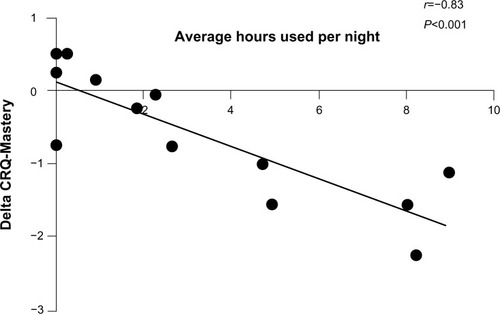
Table 5 Comparison of randomized studies of domiciliary NPPV in chronic stable COPD without hypercapnea
Table S1 Comparison between groups at each time point and over all time points (repeated-measures analysis of variance)