Figures & data
Table 1 Baseline demographics and clinical characteristics of included patients
Figure 1 (A) Spirometry (FEV1% predicted) prior to switching and after a minimum of 12 months of indacaterol treatment. Complete spirometry data were available for 14 patients. Prior to switching, the mean (SD) FEV1% predicted across all these patients was 54.5% (15.8%), and at the last assessment (after a minimum of 12 months on indacaterol) 57.1% (20.4%). No statistical differences in pre- and postswitching spirometry were seen, either for the cohort as a whole (P=0.39) or for comparisons based upon disease severity. (B) Individual percentage change in FEV1% predicted after a minimum of 12 months of indacaterol. Changes were seen on an individual patient basis. In five patients, notable improvement in spirometry was seen, while in five patients deterioration was observed; in four patients, FEV1 was relatively unchanged.
Abbreviations: FEV1, forced expiratory volume in 1 second as a percentage of forced vital capacity; SD, standard deviation.
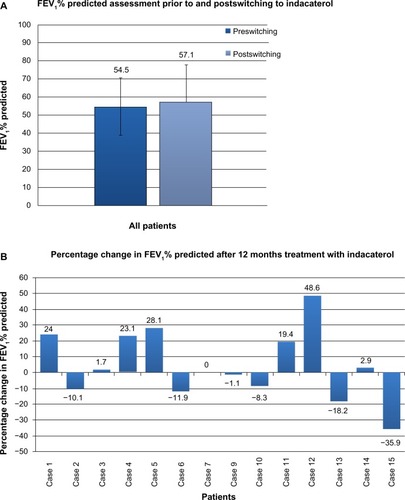
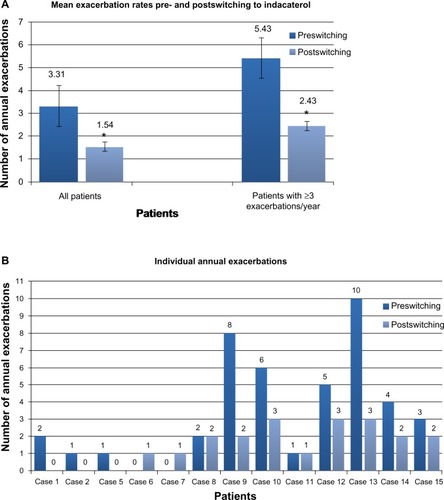
Figure 2 (A) Mean annual exacerbation rates immediately prior to and after a minimum of 12 months of indacaterol therapy. Exacerbation frequency was available in 13 patients. (range 0–10, mean 3.31±0.87, SD=3.15). Following switching to indacaterol, mean exacerbation rate fell significantly (range 0–3, mean 1.54±0.31, SD=1.13; P=0.02). In six patients classified as suffering frequent (three or more per year) exacerbations, mean exacerbation rate fell significantly from 5.43±1.07 to 2.43±0.2 after 12 months treatment with indacaterol (P=0.02). *P=0.02. (B) Individual annual exacerbation rates in the 12 months prior to switching and the last 12 months of indacaterol treatment. On an individual patient basis, a reduction in frequency of acute exacerbations was seen in nine of 13 patients (69%).