
Figures & data
Table 1 Measurements of air pollutants used in the study, 1993–2010
Figure 1 Levels of six air pollutants in North Carolina, 1993–2011. Individual pollutants were placed onto a single graph by utilizing arbitrary units to enable a collective visualization of the trends.
Abbreviation: PM, particulate matter.
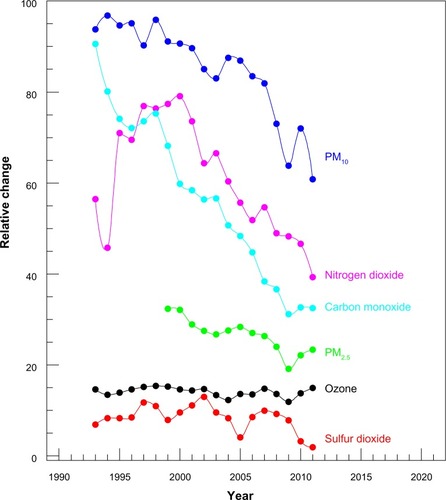
Figure 2 Seasonal fluctuations of air-pollutant levels: summer (red, 3 months) and winter (blue, 3 months), 1993–2011.
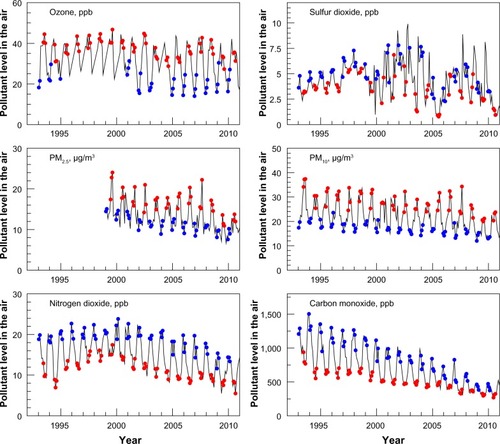
Table 2 Demographic characteristics of North Carolina population with cause-specific respiratory mortality, 1993–2010
Figure 3 Trends in death rates for emphysema, asthma, and pneumonia in North Carolina, 1983–2010. Mortality rates were age-adjusted to the 2000 North Carolina population.
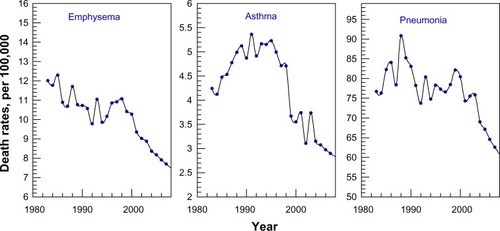
Table 3 Associations between trends in emphysema, asthma, and pneumonia death rates and dynamics of air pollutants in North Carolina, 1992–2010
Table 4 Timeline of key federal and North Carolina state-specific air regulations and actions
Table S1 Results of the sensitivity analysis