Figures & data
Figure 1 High-resolution computed tomography prior to (A) and after (B) endoscopic valve placement leading to a complete atelectasis in the left upper lobe. The arrow shows an implanted endobronchial valve.
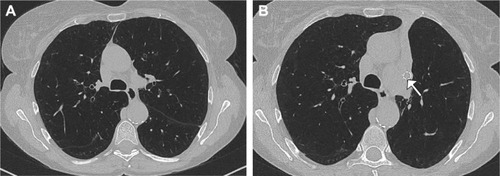
Figure 2 Different types of bronchial valves.
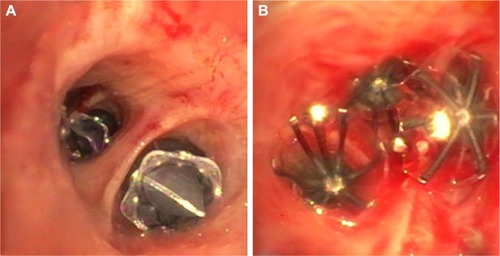
Figure 3 Recommended algorithm for patient selection depending on emphysema distribution as well as on the presence or absence of collateral ventilation.
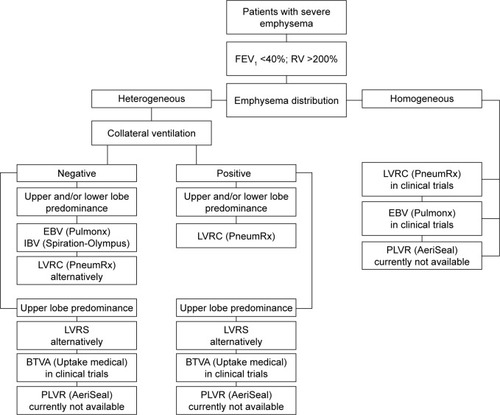
Figure 4 High-resolution computed tomography of a patient with severe emphysema showing an incomplete fissure (↑) on the right and a complete fissure on the left.
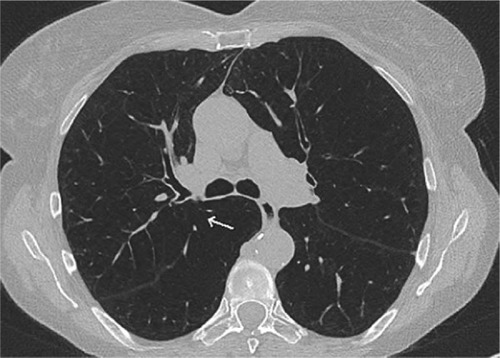
Figure 5 Assessment of collateral ventilation using Chartis system (Pulmonx Corp., Redwood City, CA, USA).
Abbreviations: P, pressure; F, flow.
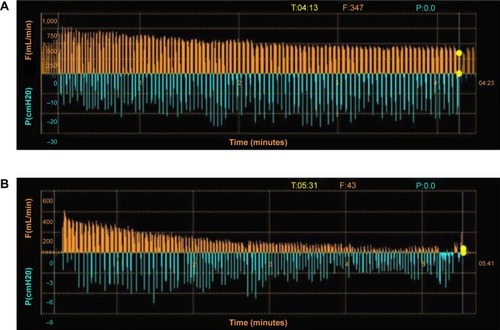
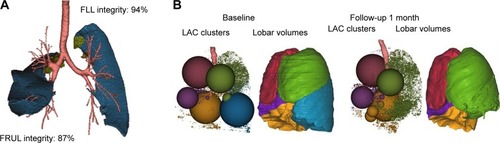
Figure 6 Automated software analysis for fissure integrity and emphysema severity and distribution using Apollo™ software (Vida Diagnostics, Inc., Minneapolis, MN, USA).
Abbreviations: FLL, fissure left lung; FRUL, fissure right upper lobe; LLL, left lower lobe; LUL, left upper lobe; RLL, right lower lobe; RML, right middle lobe; RUL, right upper lobe.