Figures & data
Table 1 Patient’s global satisfaction with the onset of effect and patient’s expectation of treatment adherence
Table 2 Demographics of the patient population (full analysis set) (means [standard deviations] are reported, unless otherwise stated)
Table 3 Primary and exploratory variables during treatment with indacaterol and placebo in the full analysis set (treatment sequences combined)
Table 4 Cumulative frequencies for time until patient’s perception of onset of effect by sequence and treatment (full analysis set)
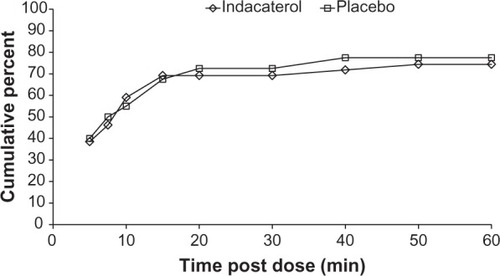
Figure 1 Cumulative distribution functions for time to patient’s perception of onset of effect by treatment.