Figures & data
Figure 1 Inhaled, long-acting muscarinic antagonists, showing the molecular structure of glycopyrronium bromide compared with other anticholinergics.
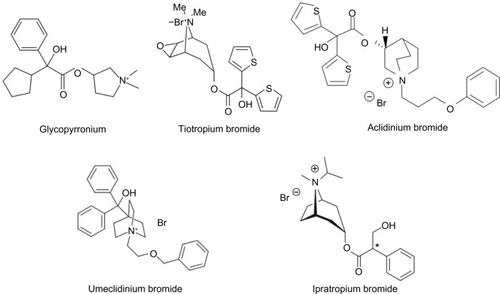
Table 1 Glycopyrronium monotherapy studies and the outcome measures assessed in each study
Table 2 Studies using glycopyrronium in combination with indacaterol and outcome measures assessed in each study
Table 3 Treatment differences with glycopyrronium versus placebo and tiotropium in the GLOW studies and SHINE trial
Table 4 Treatment differences with QVA149 versus placebo and active comparators in the Phase III IGNITE studies
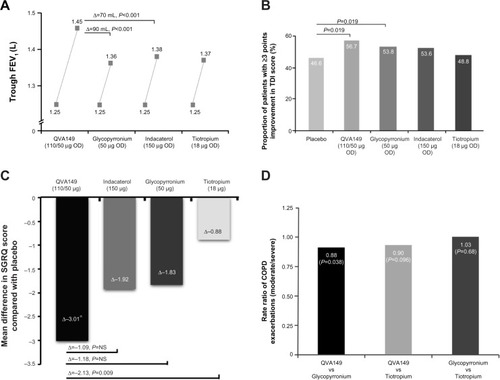
Figure 2 Effect of QVA149, its monocomponents, and tiotropium on mean trough FEV1 (A), responder analysis for improvement in TDI score (B), SGRQ score (C), and annualized rate ratio of moderate or severe COPD exacerbations (D).
Abbreviations: COPD, chronic obstructive pulmonary disease; FEV1, forced expiratory volume in 1 second; NS, nonsignificant; SGRQ, St George’s Respiratory Questionnaire; TDI, Transition Dyspnea Index.