Figures & data
Table 1 The demographics of the eight COPD patients and eight healthy controls (mean ± standard deviation)
Table 2 The top ten up- and downregulated differentially expressed genes (DEGs)
Figure 1 Heat-map results of the differentially expressed genes between samples of alveolar epithelial type II cells from lung tissues of COPD patients and normal controls. The left column with orange color represents the downregulated genes in COPD patients and the left column with pink color represents the upregulated genes in COPD. The colors in the microarray results represent fold change in each sample, with yellow indicating upregulated genes, blue indicating downregulated genes, and black indicating median-expressed genes.
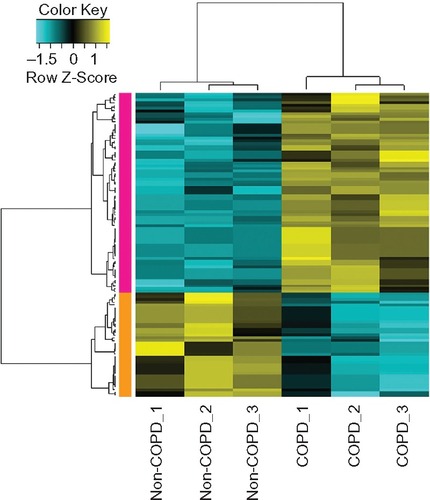
Table 3 Gene-ontology functional enrichment analysis of the differentially expressed genes
Table 4 The differentially expressed genes involved in extracellular region
Figure 2 Protein–protein interaction network in COPD patients. Nodes with colors from yellow to red represent different degrees. The lowest degree, 1, is represented by yellow and the highest degree, 10, by red.
Abbreviation: COPD, chronic obstructive pulmonary disease.
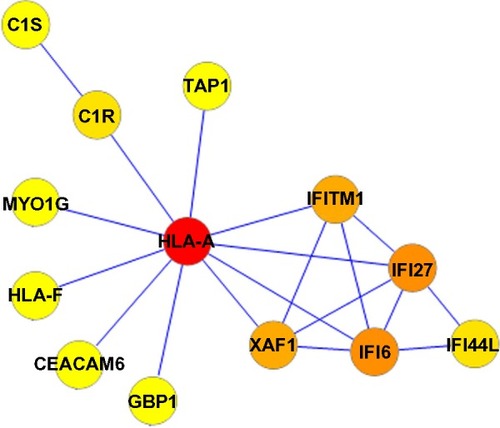
Figure 3 (A) The expression level of nuclear factor kappa-light-chain-enhancer of activated B-cells (NF-κB) and hepatocyte nuclear factor 4 alpha (HNF4A) in COPD and non-COPD. (B) Motif finding results of NF-κB and HNF4A.
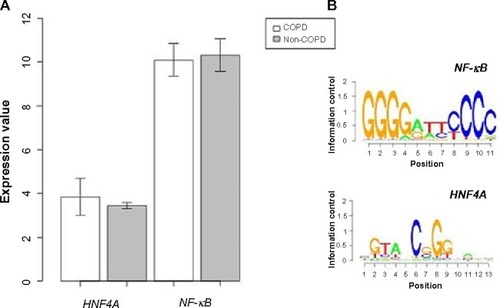
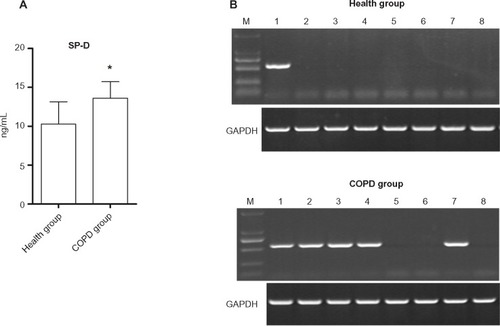
Figure 4 (A) The surfactant protein D (SP-D) serum levels of COPD patients and healthy control (*P<0.05, compared with the healthy group). (B) The HLA-A gene frequency in the blood samples of eight healthy controls (1/8, 12.5%) and eight COPD patients (5/8, 62.5%).