Figures & data
Table 1 Characteristics of all patients with COPD, and by sex
Table 2 Backwards selection modelTable Footnotea by Cox regression analysis of predictors for moderate and severe COPD exacerbations for all patients, and by sex
Table 3 Risk score formula for COPD exacerbation in the next 6 months
Figure 1 ROC curve based on the five selected predictors (C-index =0.67), the full multivariate model (C-index =0.68) and the individual predictors: post-bronchodilator FEV1 (C-index =0.62) and the number of COPD exacerbations during the previous year (C-index =0.62).
Abbreviations: COPD, chronic obstructive pulmonary disease; FEV1, forced expiratory volume in 1 second; ROC, receiver operating characteristic.
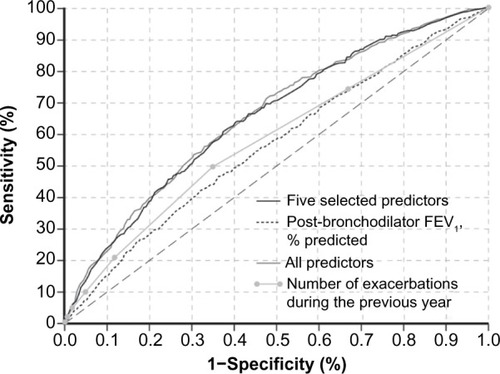
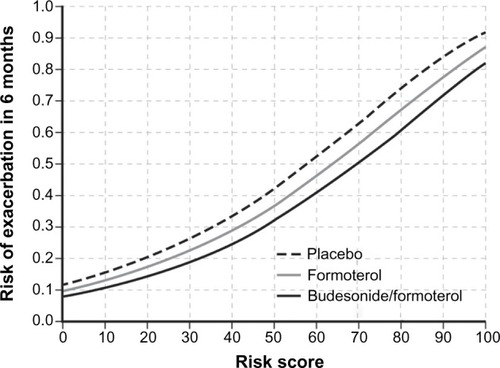
Figure 2 Risk of exacerbation in 6 months based on baseline risk score for each treatment group, with the pre-bronchodilator FEV1/FVC ratio as lung function predictor.
Abbreviations: FEV1, forced expiratory volume in 1 second; FVC, forced vital capacity.