
Figures & data
Figure 1 Preferred Reporting Items for Systematic Reviews and Meta-Analyses (PRISMA) diagram detailing the identification and inclusion process of the articles. Some studies are included in more than one analysis category; consequently, the aggregate number of studies in the repeatability, reproducibility, comparative, and protocol variation groups adds up to more than 71.
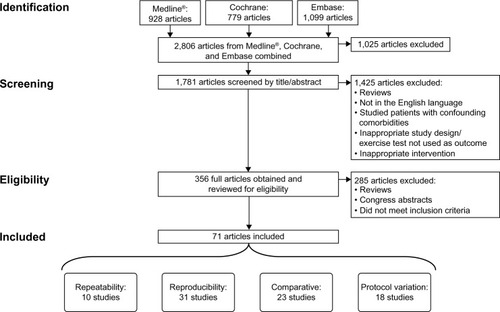
Table 1 Repeatability and reproducibility of the 6- and 12-minute walk tests
Table 2 Repeatability and reproducibility of incremental shuttle walk test, endurance shuttle walk test, incremental treadmill test, and endurance treadmill test
Table 3 Repeatability and reproducibility of cycling tests
Table 4 Between-test comparisons of sensitivity to interventions
Table 5 Protocol variations reported to affect performance of exercise capacity test
Table S1 Embase™ search strings, search conducted January 22, 2013
Table S2 Medline® search strings, search conducted January 22, 2013
Table S3 The Cochrane Library search strings, search conducted January 22, 2013