
Figures & data
Figure 1 Study design.
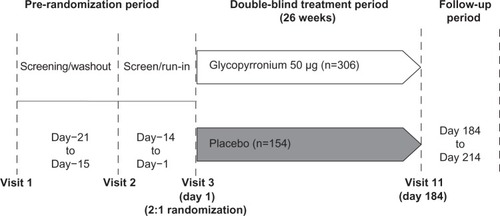
Table 1 Demographics and baseline clinical characteristics (safety set)
Figure 2 Patients’ dispositions.
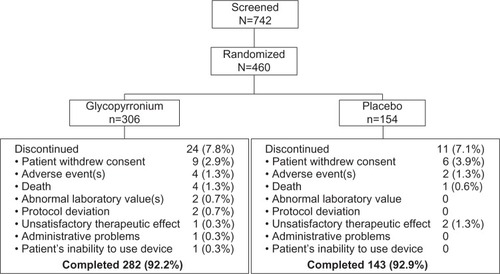
Figure 3 Improvement in trough forced expiratory volume in 1 second (FEV1) on Day 1, Week 12 and Week 26.
Notes: Data are least square means (standard error); *P<0.001.
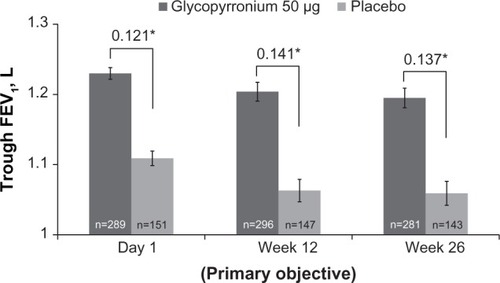
Figure 4 Forest plot of the treatment differences between glycopyrronium and placebo in trough forced expiratory volume in 1 second (FEV1) by subgroups at Week 12.
Abbreviations: CI, confidence interval; COPD, chronic obstructive pulmonary disease; LSM, least square mean; ICS, inhaled corticosteroids.
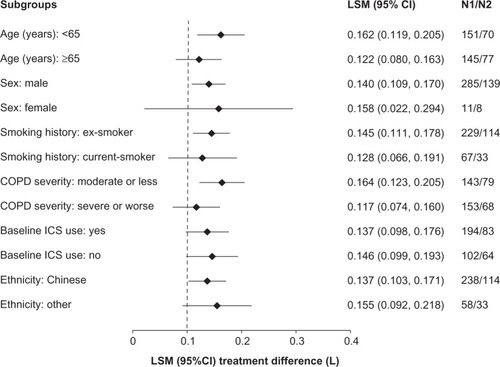
Table 2 Improvement in lung function and reduction in rescue medication use and symptom score during the GLOW7 study
Figure 5 Improvement (A) and percentage of patients with MCID (B) in SGRQ total score at Week 12 and Week 26.
Notes: ***P<0.001; **P<0.01; *P<0.05.
Abbreviations: LSM, least square mean; MCID, minimum clinically important difference; OR, odds ratio; SE, standard error; SGRQ, St George’s Respiratory Questionnaire.
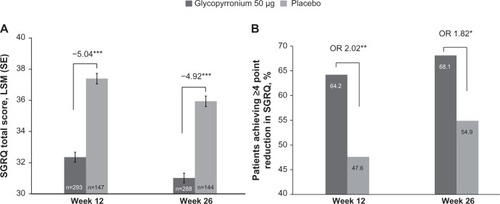
Figure 6 Improvement (A) and percentage of patients with MCID (B) in TDI focal score at Week 12 and Week 26.
Abbreviations: LSM, least square mean; MCID, minimum clinically important difference; OR, odds ratio; SE, standard error; TDI, Transition Dyspnea Index.
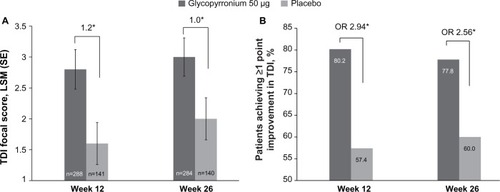
Figure 7 Kaplan–Meier plot of the time to first moderate or severe chronic obstructive pulmonary disease exacerbation.
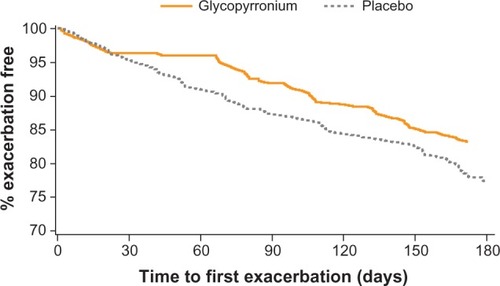
Table 3 Summary of resource utilization over the 26 week treatment period
Table 4 AEs ($1% in either treatment group), SAEs and discontinuations due to AEs and SAEs, n (%)