
Figures & data
Figure 1 Frequency of occurrence (A) and severity of COPD symptoms (B) over the study period.
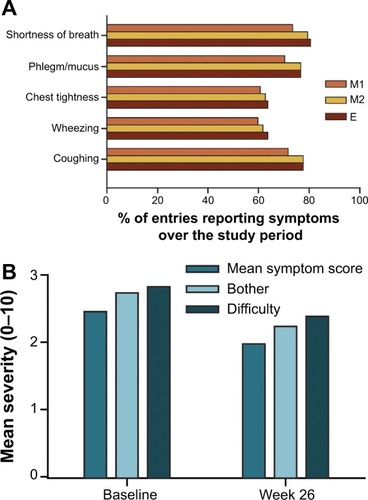
Table 1 Correlations (Pearson’s r) between individual symptoms and overall bother/difficulty with activities caused by COPD symptoms at baseline
Table 2 Factor loadings for the single factor identified by exploratory factor analysis (EFA) using baseline data
Table 3 Internal consistency estimates for eDiary items
Table 4 Spearman’s correlation between eDiary (overall) and the SGRQ and BDI scores at baseline
Figure 2 Sensitivity to change of the eDiary at week 26.
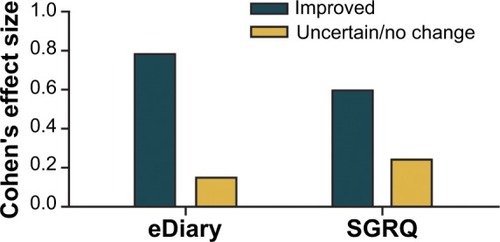
Table 5 Reductions in the overall eDiary mean total score with the lowest level of improvement on each scale at week 26
Figure S1 COPD exploratory eDiary (English for UK version).
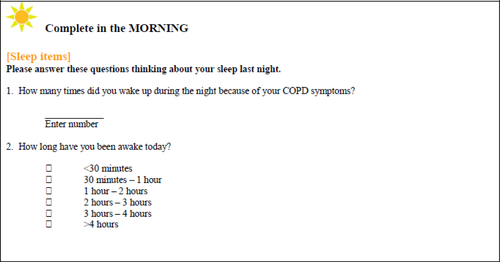
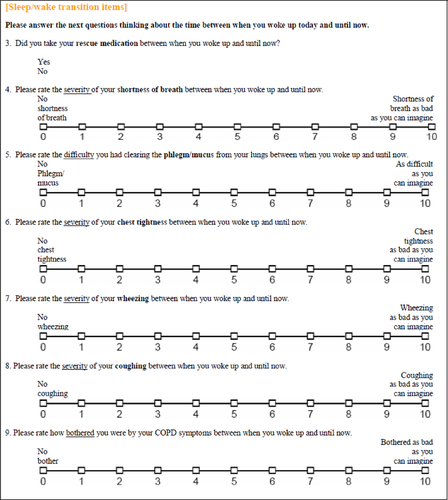
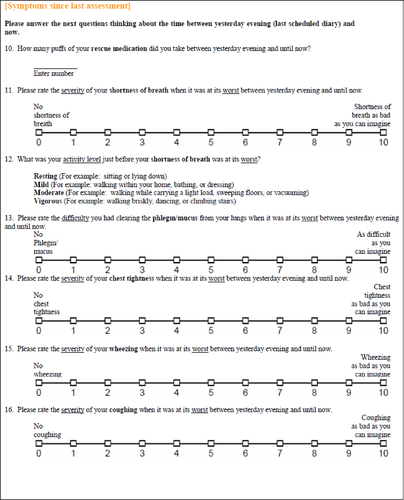
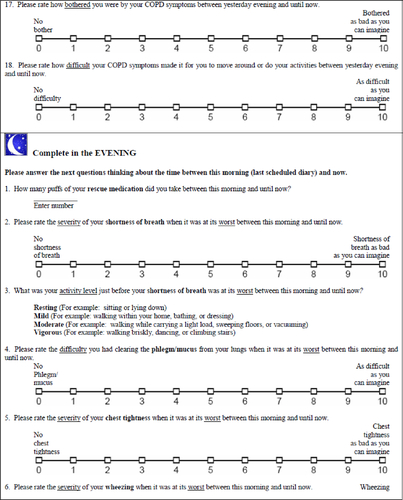
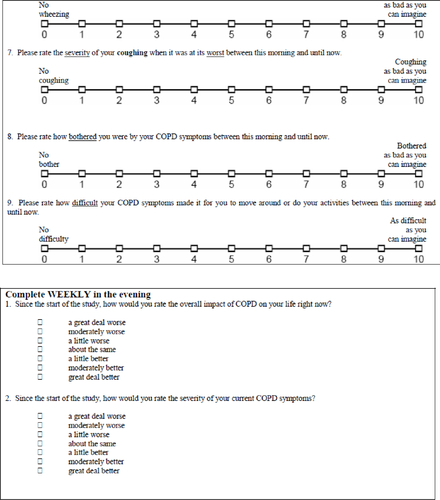
Figure S2 Cumulative distribution curves (point change) for the eDiary mean total score over all three time frames.
Abbreviation: eDiary, electronic patient diary.
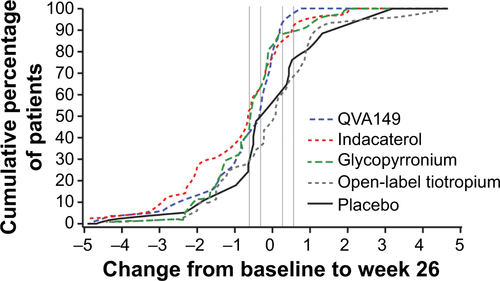
Table S1 Correlations of eDiary items and summary scores against BDI and SGRQ score