Figures & data
Table 1 Demographic and pulmonary function data of the subjects with COPD
Table 2 Results of the 6-minute walk test
Table 3 Change over time in the 6-minute walk test
Figure 1 Relationship between the Borg CR-10 scale and IC in the 6-minute walk test.
Abbreviations: CR, category-ratio; IC, inspiratory capacity.
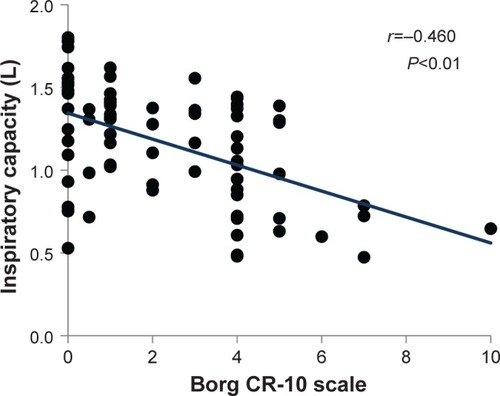
Figure 2 Relationship between the changes in the Borg CR-10 scale and IC in the 6-minute walk test.
Abbreviations: CR, category-ratio; IC, inspiratory capacity.
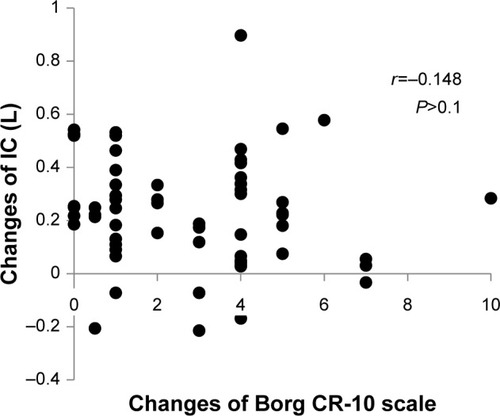
Figure 3 Changes over time of the VT, IRV, and Borg CR-10 scale in the 6-minute walk test.
Notes: The sum of VT and IRV shows IC. IC and IRV decrease significantly over time (P<0.01).
Abbreviations: VT, tidal volume; IRV, inspiratory reserve volume; CR, category-ratio; IC, inspiratory capacity; min, minutes.
Abbreviations: VT, tidal volume; IRV, inspiratory reserve volume; CR, category-ratio; IC, inspiratory capacity; min, minutes.
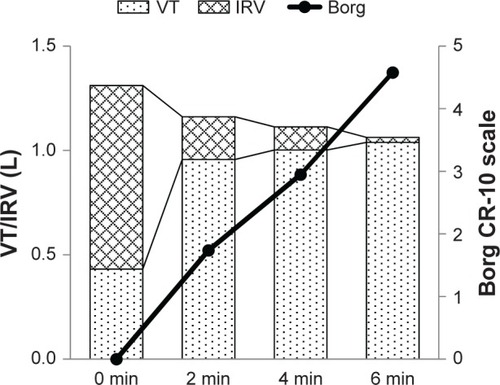
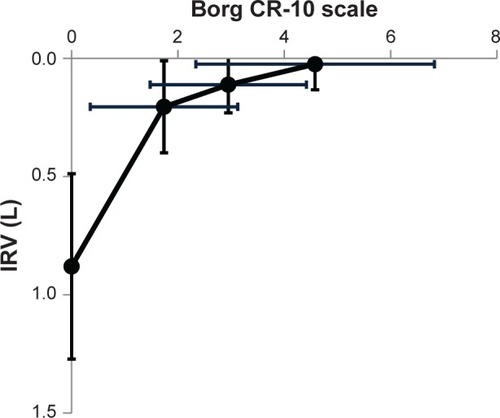
Figure 4 Relationship between the Borg CR-10 scale and the IRV in 6-minute walk test.
Abbreviations: CR, category-ratio; IRV, inspiratory reserve volume.