
Figures & data
Figure 1 Flow diagram summarizing the selection process for clinical-effectiveness studies.
Abbreviation: RCT, randomized controlled trial.
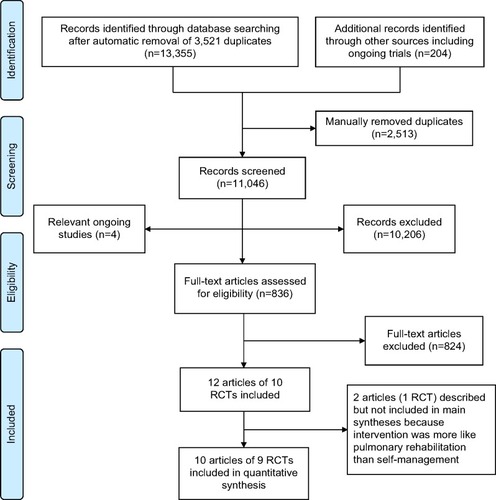
Table 1 Characteristics of included RCTs
Figure 2 Summary diagram of interventions.
Abbreviations: COPD, chronic obstructive pulmonary disease; mth, month.
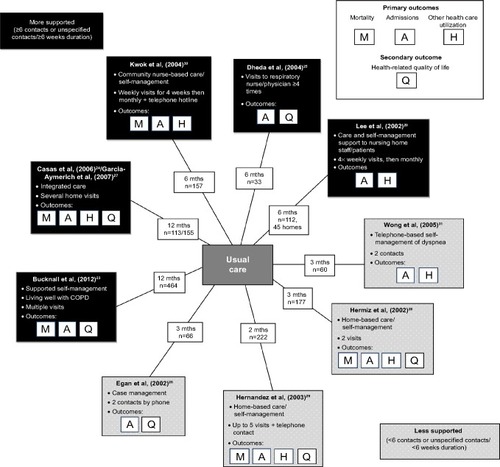
Figure 3 Effect of self-management support interventions on mortality.
Abbreviations: CI, confidence interval; NR, not reported; HR, hazard ratio; int, intervention; cont, control.
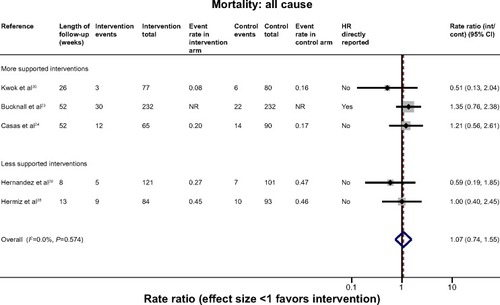
Figure 4 Effect of self-management support interventions on time to first re-admission.
Notes: *COPD-related admission. All others unknown/unclear cause.
Abbreviations: COPD, chronic obstructive pulmonary disease; NR, not reported; HR, hazard ratio; CI, confidence interval; int, intervention; cont, control.
Abbreviations: COPD, chronic obstructive pulmonary disease; NR, not reported; HR, hazard ratio; CI, confidence interval; int, intervention; cont, control.
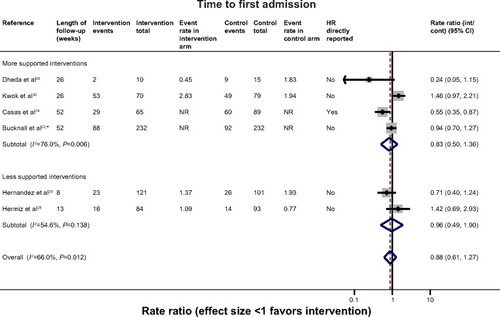
Table 2 Results of additional clinical outcomes
Figure 5 Effect of self-management support interventions on health-related quality of life (SGRQ score).
Note: Positive effect signifies improvement.
Abbreviations: SGRQ, St George’s Respiratory Questionnaire; NR, not reported; ANCOVA, analysis of covariance; int, intervention; cont, control; CI, confidence interval.
Abbreviations: SGRQ, St George’s Respiratory Questionnaire; NR, not reported; ANCOVA, analysis of covariance; int, intervention; cont, control; CI, confidence interval.
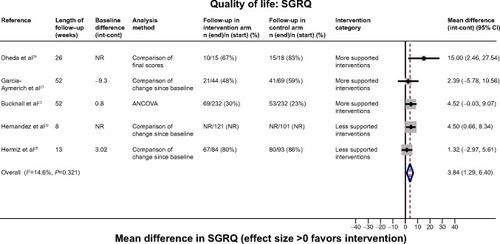
Table 3 Results of patient-reported knowledge, self-efficacy, and behavior