
Figures & data
Figure 1 Asbestos bodies.
Notes: Prussian blue-stained section from a subject with asbestos exposure and interstitial fibrosis. Original magnification ×200.
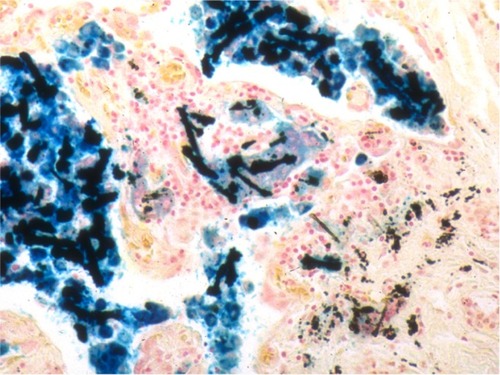
Figure 2 Smoking-associated interstitial fibrosis.
Notes: Hematoxylin and eosin stained section. Note the widening of alveolar septae by dense eosinophilic fibrosis with a paucity of inflammatory cells. Original magnification ×200.
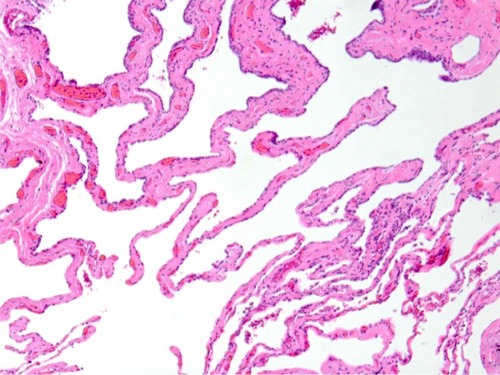
Table 1 Subjects’ profession, duration of asbestos exposure, smoking status, and type of malignancy
Table 2 Subtypes of malignancy diagnoses within the cohort
Figure 3 Flow chart showing the breakdown of cases with and without histologic and radiologic evidence of asbestosis and fibrosis. *<1 and ≥1 refer to ILO profusion.
Abbreviation: ILO, International Labor Organization.
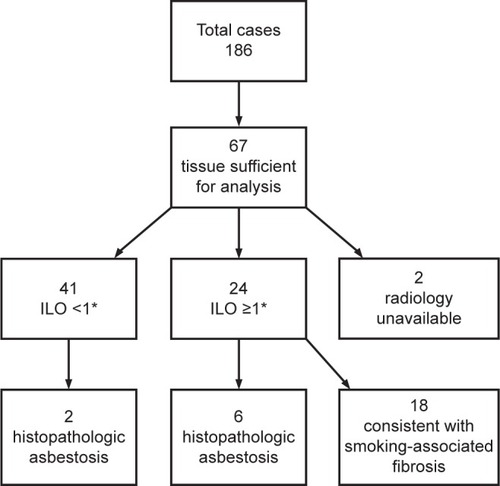
Table 3 Correlation of ILO profusion, histopathologic evidence of asbestosis, and smoking
Table 4 Demographics of 24 cases with ILO profusion ≥1 and sufficient tissue for histopathologic evaluation