
Figures & data
Table 1 Comparisons of quantitative pulmonary measurements using different tube current and reconstruction settings (n=22)
Figure 1 Example of emphysema measurements made by the workstation used in this study.
Notes: Low attenuation areas (LAA, < −950 HU) are shown as red-colored areas. For this case (81 year old male, 62 kg), when using AIDR3D, measured LAA% results were 6.8% at 240 mA, 7.7% at 120 mA, and 8.0% at 60 mA. When not using AIDR3D (ie, when using FBP), LAA% results were 9.2% at 240 mA, 12.0% at 120 mA, and 15.3% at 60 mA. Note that LAA% measurements were obtained automatically for the entire lung and not from these single axial images.
Abbreviations: LAA%, percent low attenuation area; AIDR3D, Adaptive Iterative Dose Reduction using Three Dimensional Processing; FBP, filtered-back projection; HU, Hounsfield unit.
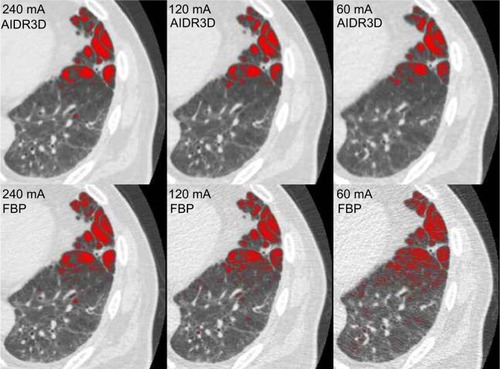
Figure 2 Image noise analysis.
Abbreviations: AIDR3D, Adaptive Iterative Dose Reduction using Three Dimensional Processing; SD, standard deviation; HU, Hounsfield unit.
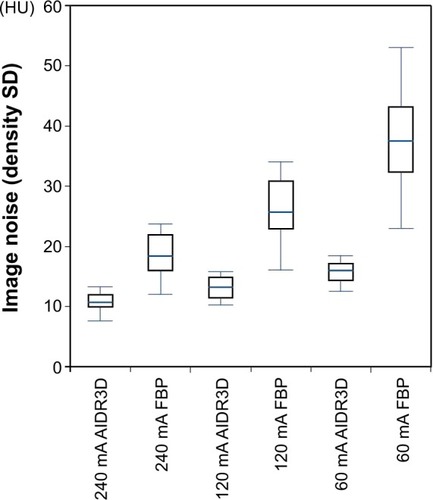
Table 2 Correlations between patients’ body weights and measurement differences among three tube current settings