
Figures & data
Table 1 Characteristics of selected studies
Figure 1 Flow diagram for identification of selected articles.
Abbreviation: BLVR, bronchoscopic lung volume reduction.
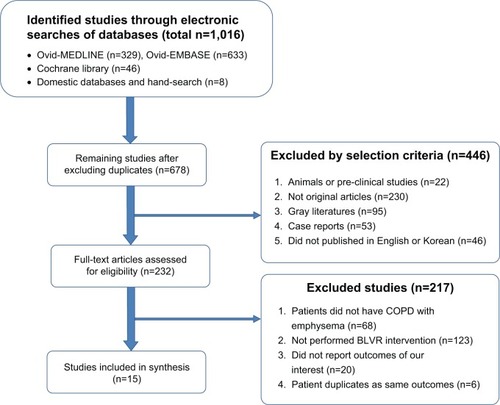
Figure 2 Forest plots of effectiveness outcomes – mean change differences from baseline between BLVR group and control group.
Abbreviations: BLVR, bronchoscopic lung volume reduction; ΔFEV1, change in forced expiratory volume in 1 second; SE, standard error; IV, independent variable; CI, confidence interval; Δ6MWD, change in 6-minute walking distance; ΔCycle workload, change in cycle workload; ΔSGRQ, change in St George’s Respiratory Questionnaire.
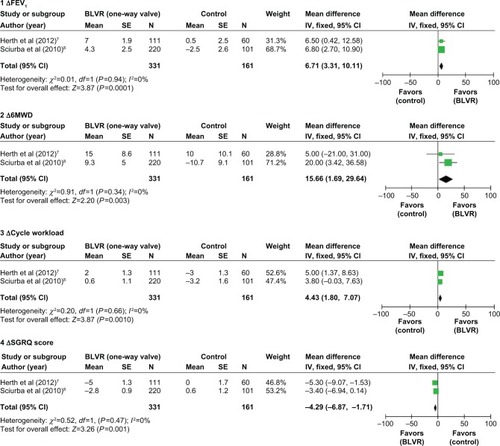
Table 2 Clinical outcomes in change from baseline according to fissure