Figures & data
Table 1 Baseline characteristics and medication of the study participants of the hypoxia (n=8) and the control group (n=8). Values are means ± standard deviation or numbers (frequencies)
Table 2 Characteristics of the 3-week breathing program and inspiratory fractions of oxygen (FiO2) during the breathing cycles of the hypoxia (n=8) and control (n=8) groups
Figure 1 Changes in arterial oxygen saturation from normoxia to acute hypoxia (hypoxia group; black line, n=8), or sham hypoxia (control group; gray line; n=8) during the 15 breathing sessions.
Abbreviation: FiO2, inspired fraction of oxygen.
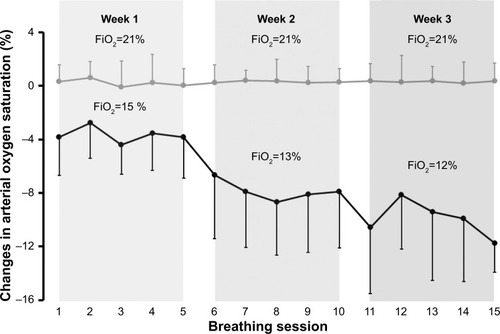
Figure 2 Changes in blood pressure, heart rate and rate pressure product from normoxia to acute hypoxia (hypoxia group; n=8) or sham hypoxia (control group; n=8) during the 15 breathing sessions.
Notes: Data are averages of the 3 to 5 hypoxic/sham hypoxic periods within each breathing session. Values are means ± standard deviation.
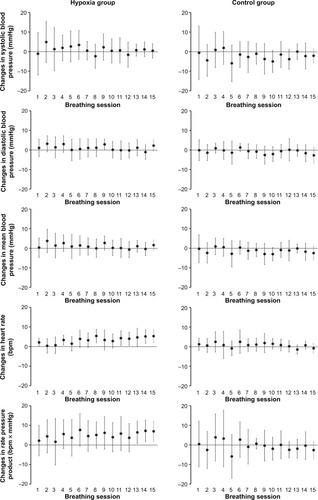
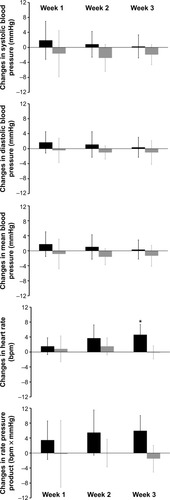
Figure 3 Changes in blood pressure, heart rate and rate pressure product from normoxia to acute hypoxia (hypoxia group; n=8) or sham hypoxia (control group; n=8) during the 3 weeks of the breathing program.