Figures & data
Table 1 Sociodemographic and clinical characteristics
Table 2 Patients’ experience of chronic obstructive lung disease symptoms at nighttime evaluated using the NiSCI: baseline weekTable Footnotea
Table 3 Summary of NiSCI item analyses for decision making
Figure 1 Final conceptual framework.
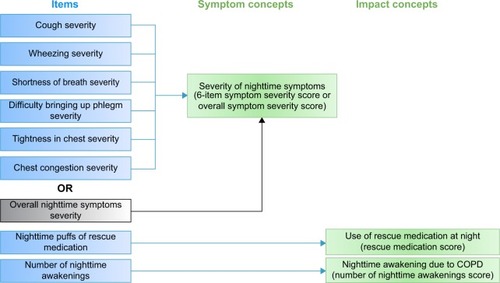
Table 4 CorrelationTable Footnotea of NiSCI scores with SGRQ, E-RS total, and FEV1Table Footnoteb at baseline week
Figure 2 NiSCI scores by SGRQ total score at baseline week.
Notes: Values above bars indicate the mean (standard deviation) for each. Error bars represent standard error of the mean. Significance level for comparison: ***P<0.0001; sample median 47.48.
Abbreviations: NiSCI, Nighttime Symptoms of COPD Instrument; SGRQ, St George’s Respiratory Questionnaire; SE, standard error.
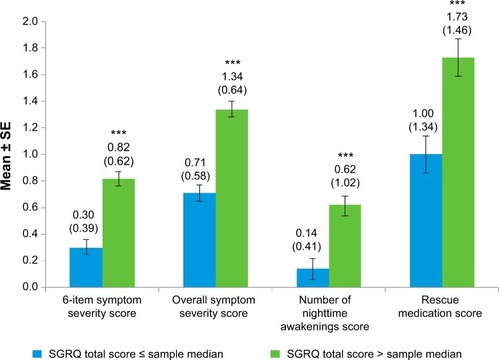
Figure 3 NiSCI scores by SGRQ symptom score at baseline week.
Notes: Values above bars indicate the mean (standard deviation) for each. Error bars represent standard error of the mean. Significance level for comparison: ***P<0.0001; sample median 69.46.
Abbreviations: NiSCI, Nighttime Symptoms of COPD Instrument; SGRQ, St George’s Respiratory Questionnaire; SE, standard error.

Figure 4 NiSCI scores by E-RS score at baseline week.
Notes: Values above bars indicate the mean (standard deviation) for each. Error bars represent standard error of the mean. Significance level for comparison: **P<0.001; ***P<0.0001; sample median 11.
Abbreviations: NiSCI, Nighttime Symptoms of COPD Instrument; E-RS, Exacerbations of Chronic Obstructive Pulmonary Disease Tool-Respiratory Symptoms; SE, standard error.
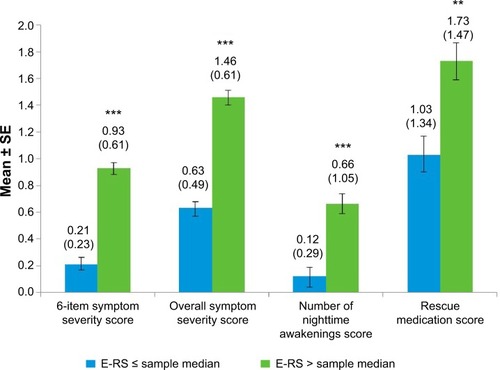
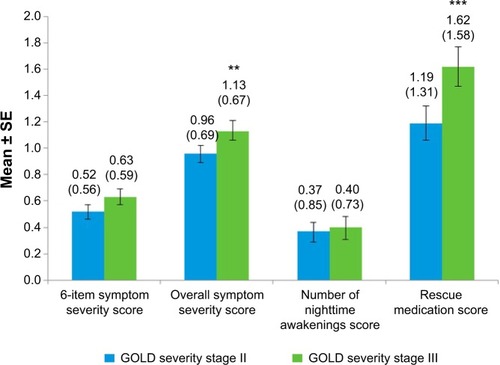
Figure 5 NiSCI scores by GOLD severity stages II and III at baseline week.
Abbreviations: NiSCI, Nighttime Symptoms of COPD Instrument; GOLD, Global Initiative for Chronic Obstructive Lung Disease; SE, standard error.