Figures & data
Table 1 Demographics
Table 2 Proteins with the highest spectral counts in the 56 induced sputum specimens (mean [95% confidence interval])
Figure 1 Patterns for relationships between protein spectral count percentiles and frequencies of detection for each phenotype.
Abbreviations: Non, nonsmokers; HS, healthy smokers; CB, chronic bronchitic patients; E&C, patients with significant emphysema and airflow obstruction; ANOVA, analysis of variance.
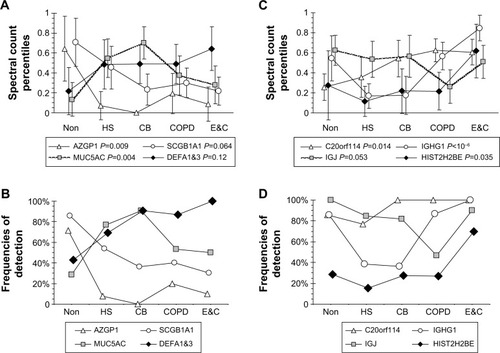
Figure 2 Secretory IgA-related proteins.
Abbreviations: Non, nonsmokers; HS, healthy smokers; CB, chronic bronchitic patients; E&C, patients with significant emphysema and airflow obstruction.
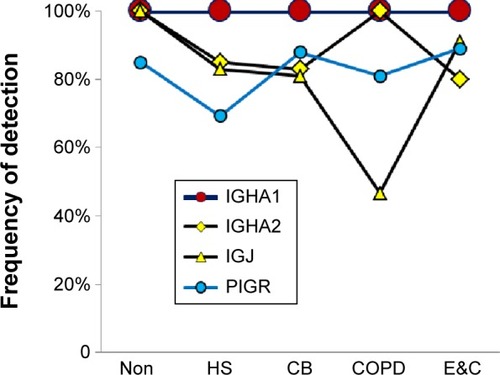
Figure 3 Submucosal gland serous cell proteins.
Abbreviations: Non, nonsmokers; HS, healthy smokers; CB, chronic bronchitic patients; E&C, patients with significant emphysema and airflow obstruction.
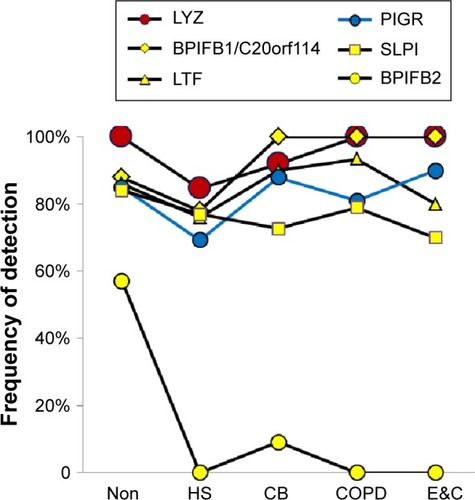
Figure 4 Epithelial proteins.
Abbreviations: Non, nonsmokers; HS, healthy smokers; CB, chronic bronchitic patients; E&C, patients with significant emphysema and airflow obstruction.
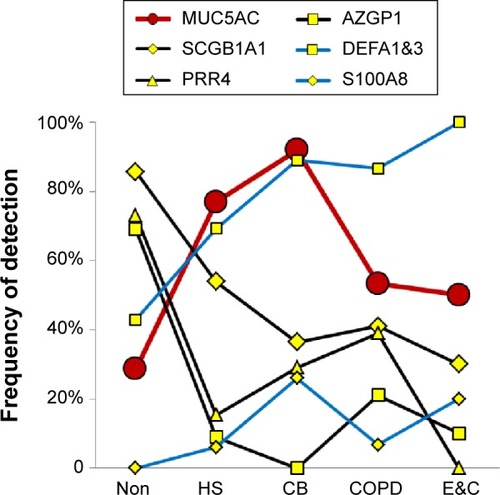
Figure 5 Submucosal gland mucous cell proteins.
Abbreviations: Non, nonsmokers; HS, healthy smokers; CB, chronic bronchitic patients; E&C, patients with significant emphysema and airflow obstruction.
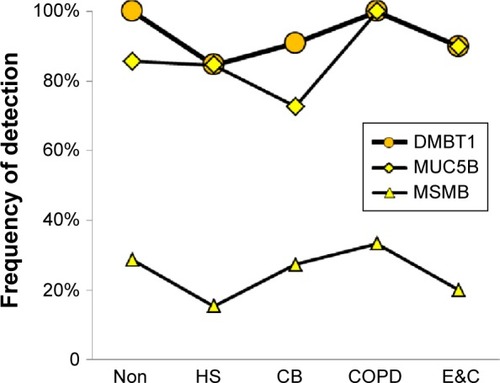
Figure 6 Cellular proteins.
Abbreviations: Non, nonsmokers; HS, healthy smokers; CB, chronic bronchitic patients; E&C, patients with significant emphysema and airflow obstruction.
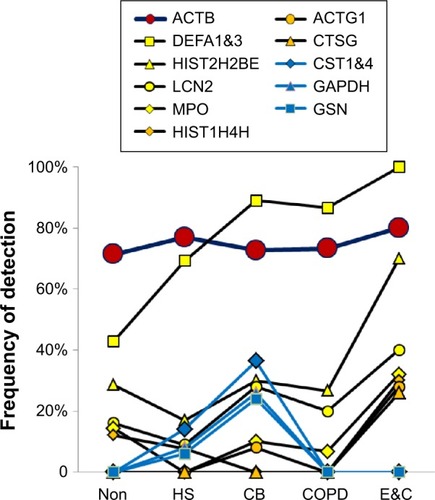
Figure 7 Plasma proteins.
Abbreviations: Non, nonsmokers; HS, healthy smokers; CB, chronic bronchitic patients; E&C, patients with significant emphysema and airflow obstruction.
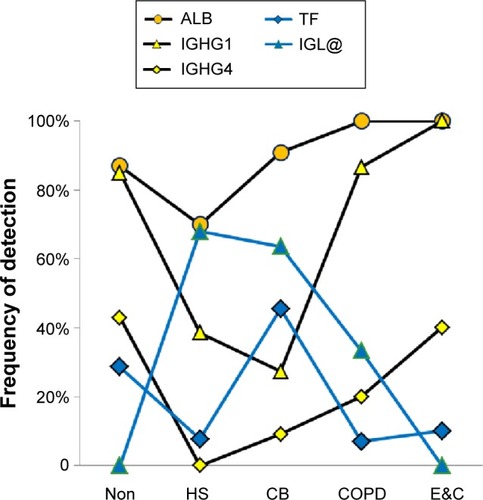
Figure 8 Correlation analysis for Non-group proteins.
Abbreviation: Non, nonsmokers.
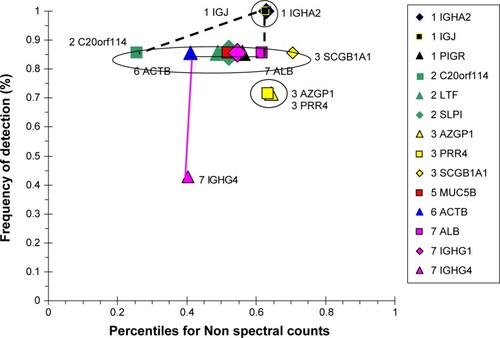
Figure 9 Correlation analysis for HS-group proteins.
Abbreviation: HS, healthy smokers.
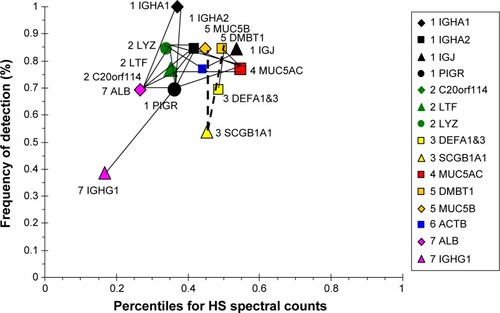
Figure 10 Correlation analysis for CB-group proteins.
Abbreviation: CB, chronic bronchitic patients.
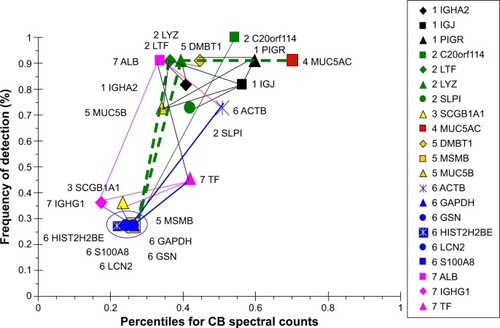
Figure 11 Correlation analysis for COPD-group proteins.
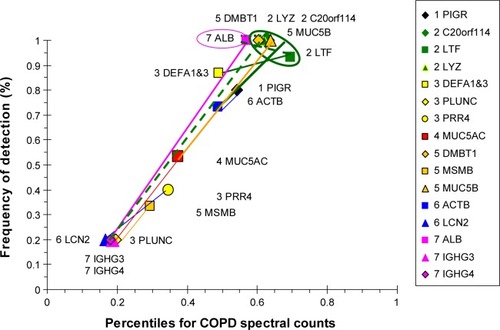
Figure 12 Correlation analysis for E&C-group proteins.
Abbreviation: E&C, patients with significant emphysema and airflow obstruction.
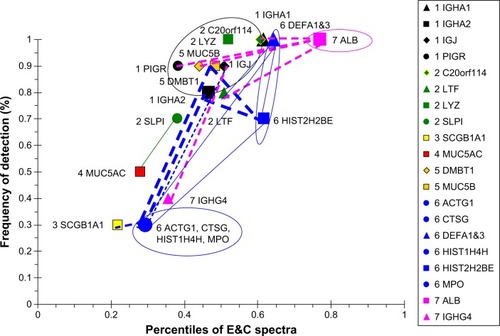
Figure 13 Cytoscape network analysis for nonsmokers.
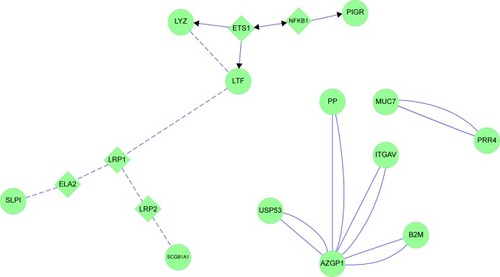
Figure 14 MUC5AC and glandular serous cell proteins LYZ, LTF, SLPI and PIGR in healthy smokers (HS).
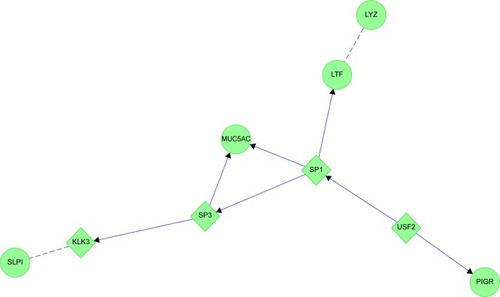
Figure 15 Chronic bronchitis: the two protein interaction networks suggest that distinct pathological mechanisms contribute to bronchial pathology.
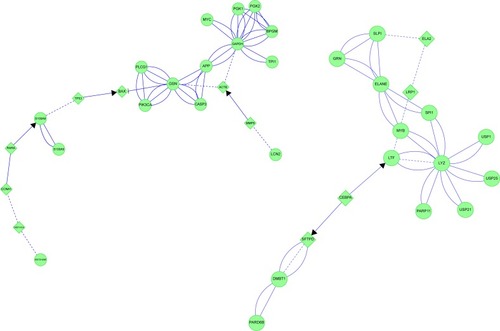
Figure 16 COPD: protein interaction networks suggest central roles for transcription factors in bronchiole pathology.
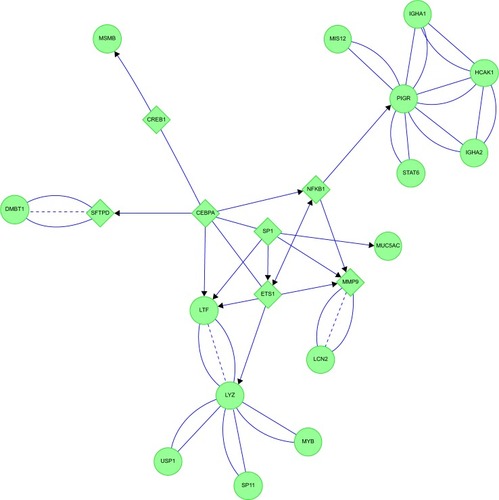
Figure 17 Emphysema: neutrophil and plasma protein inflammatory cascades were inferred from protein interaction networks.
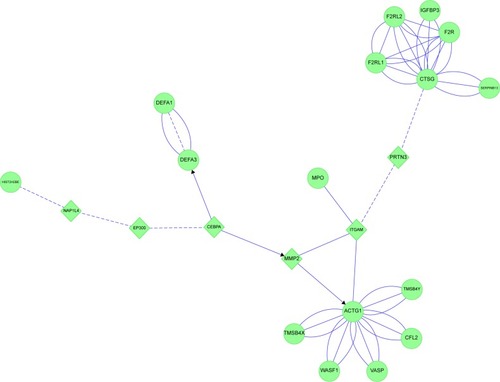
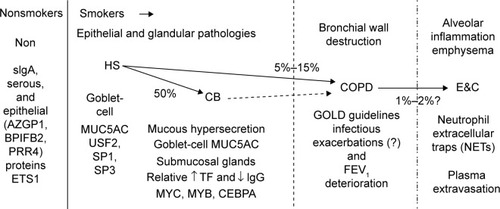
Figure 18 Sputum proteome-derived approach to cigarette smoke-induced lung diseases.
Abbreviations: Non, nonsmokers; HS, healthy smokers; CB, chronic bronchitic patients; E&C, patients with significant emphysema and airflow obstruction; sIgA, secretory IgA; GOLD, Global initiative for chronic Obstructive Lung Disease.