
Figures & data
Table 1 Baseline demographics for all subjects
Figure 1 CONSORT diagram of study recruitment, allocation, drop-out and completion.
Notes: *Cardiac history, alcohol excess, maintenance prednisolone/antibiotics, withdrew consent, other respiratory diagnosis, never smoker, outside age range.
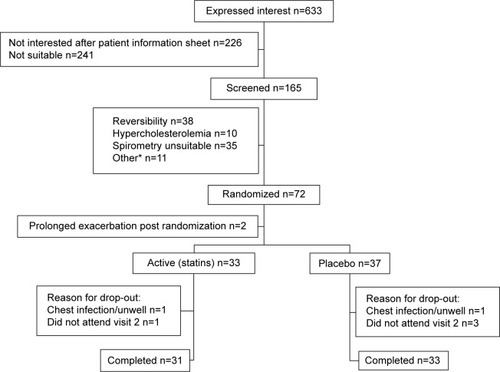
Table 2 Cardiovascular measurements
Figure 2 Change in aortic PWV for active treatment and placebo groups in (A) the total study group and (B) those with a high baseline aortic PWV. Line represents mean drop from baseline. Dotted line indicates active (simvastatin) arm. Black solid line indicates placebo. Error bars indicate the standard error.
Abbreviation: PWV, pulse wave velocity.
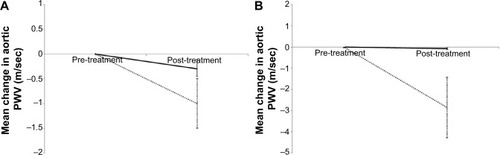
Table 3 Patients with a high baseline aortic PWV >10 m/sec
Table S1 Baseline demographics in subjects with a high baseline aortic pulse wave velocity
Table S2 Physiological and inflammatory measures
Table S3 Patient-reported side effects and blood tests for safety