
Figures & data
Table 1 Clinical characteristics of study subjects
Figure 1 Concentrations of (A) interleukin (IL)-17 and (B) growth-related oncogene (GRO)-α protein in blood (see “Materials and methods”) harvested from smokers with obstructive pulmonary disease including chronic bronchitis (OPD-CB) during stable conditions at the time of inclusion, compared with never-smokers (NS) and asymptomatic smokers (AS).
Notes: Data are presented as individual (circles) and median (bold lines) values. *P<0.05 (Kruskal–Wallis test followed by Mann–Whitney U-test). The detection limit of the respective enzyme-linked immunosorbent assay is indicated (dashed line). Numbers in parentheses indicate extreme observations “out of scale”.
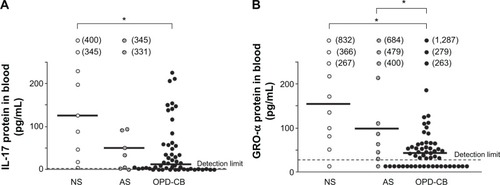
Figure 2 Correlation (Spearman’s rank correlation) between the blood concentrations of interleukin (IL)-17 and growth-related oncogene (GRO)-α protein (see “Materials and methods”) harvested from smokers (ie, smokers with obstructive pulmonary disease including chronic bronchitis [filled circles, n=47] and asymptomatic smokers [open circles, n=9]) during stable clinical conditions at the time of inclusion.
![Figure 2 Correlation (Spearman’s rank correlation) between the blood concentrations of interleukin (IL)-17 and growth-related oncogene (GRO)-α protein (see “Materials and methods”) harvested from smokers (ie, smokers with obstructive pulmonary disease including chronic bronchitis [filled circles, n=47] and asymptomatic smokers [open circles, n=9]) during stable clinical conditions at the time of inclusion.](/cms/asset/c03640b0-0802-4519-939e-2e66b10a00ad/dcop_a_76273_f0002_b.jpg)
Table 2 Inflammatory cells and cytokines in the blood for mild and severe OPD-CB
Table 3 Impact of inhaled glucocorticoids on inflammatory cells and cytokines in the blood of smokers with OPD-CB
Figure 3 Correlation between the concentrations of neutrophils and growth-related oncogene (GRO)-α protein (Spearman’s rank correlation) in blood (see “Materials and methods”) from smokers with obstructive pulmonary disease including chronic bronchitis having severe disease (corresponding to stage III+IV) according to the Global initiative for chronic Obstructive Lung Disease (GOLD) during stable clinical conditions at the time of inclusion.
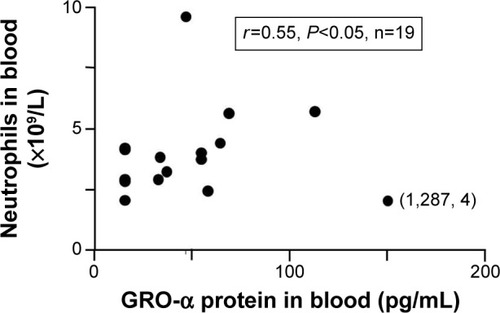
Figure 4 Comparisons of the concentrations of (A) interleukin (IL)-17 (n=34–38) and (B) growth-related oncogene (GRO)-α protein (n=24–32) in blood (see “Materials and methods”) from smokers with obstructive pulmonary disease including chronic bronchitis before, during, and after the first exacerbation.
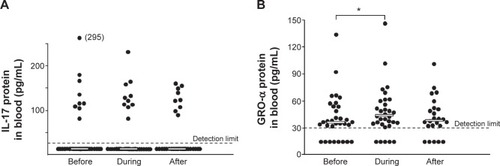
Figure S1 Concentrations of growth-related oncogene (GRO)-α protein in blood (see “Materials and methods”) versus ventilatory lung function (forced expiratory volume in 1 second [FEV1]) in the entire study population (ie, the pooled group of never-smokers, asymptomatic smokers, and smokers with obstructive pulmonary disease including chronic bronchitis) during stable clinical conditions at the time of inclusion.
Notes: Data are presented as individual values (circles), and the numbers in parentheses indicate observations “out of scale”. The statistical analysis of correlation (in the box) was conducted using Spearman’s rank correlation.
![Figure S1 Concentrations of growth-related oncogene (GRO)-α protein in blood (see “Materials and methods”) versus ventilatory lung function (forced expiratory volume in 1 second [FEV1]) in the entire study population (ie, the pooled group of never-smokers, asymptomatic smokers, and smokers with obstructive pulmonary disease including chronic bronchitis) during stable clinical conditions at the time of inclusion.Notes: Data are presented as individual values (circles), and the numbers in parentheses indicate observations “out of scale”. The statistical analysis of correlation (in the box) was conducted using Spearman’s rank correlation.](/cms/asset/3a825af4-6212-4928-b07f-b847e78807e0/dcop_a_76273_sf0001_b.jpg)
Figure S2 Overview of the growth of bacteria in sputum samples from smokers with obstructive pulmonary disease including chronic bronchitis during stable clinical conditions at the time of inclusion and during exacerbations.
Note: Data shown include the number of subjects (n) with growth of each particular bacterial finding in sputum samples representative of the peripheral airways (see “Materials and methods”).
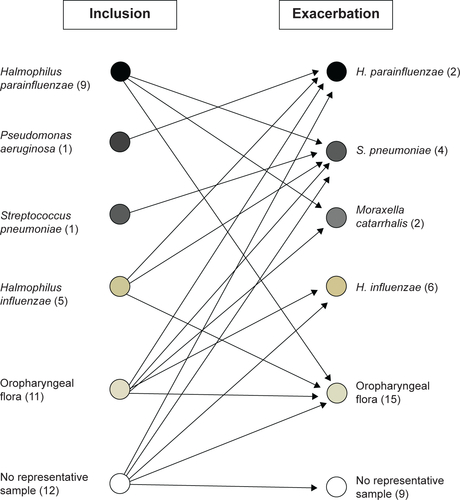
Table S1 C-reactive protein and inflammatory cells in blood at the time of inclusion and during exacerbations for smokers with OPD-CB