
Figures & data
Table 1 Characteristics of COPD patients at study entry
Figure 1 Follow-up diagram for cohort of patients with chronic obstructive pulmonary disease.
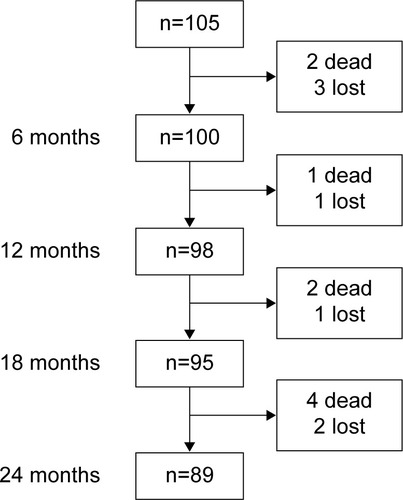
Figure 2 Number of exacerbations per patient.
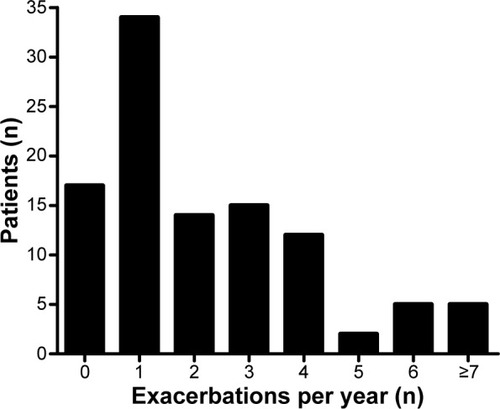
Table 2 Baseline characteristics according to frequency of exacerbations in 100 patients with COPD
Table 3 Slopes of all indices according to the random effect modeling
Figure 3 Lung function indices progression.
Notes: Baseline (0) and scheduled visits (every 6 months) during 2 years of follow-up; values are expressed as the mean ± one standard error. (⋄) indicates infrequent exacerbators; (■) indicates frequent exacerbators.
Abbreviations: IC, inspiratory capacity; FVC, forced vital capacity; FEV1, forced expiratory volume in 1 second; pred, predicted.
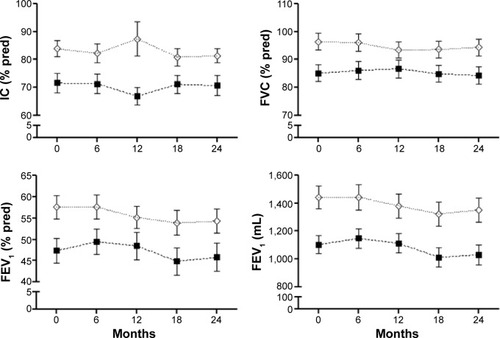
Figure 4 Clinical indices and health status progression.
Abbreviations: BMI, body mass index; mMRC, modified Medical Research Council dyspnea scale; 6WD, 6-minute walking distance; BODE, body mass index, airflow obstruction, dyspnea, exercise performance; SGRQ, St George’s Respiratory Questionnaire; CRQ, Chronic Respiratory Questionnaire.
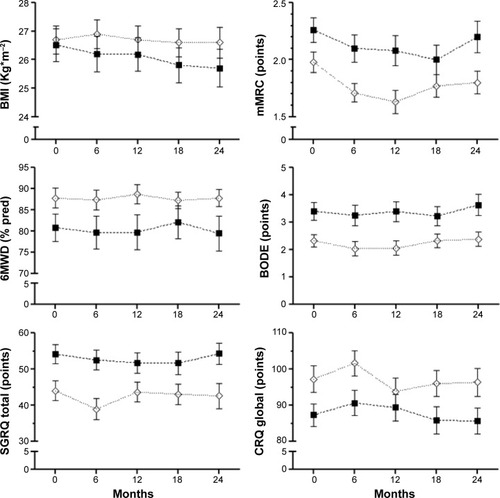
Table 4 Inhaled treatment during follow-up