Figures & data
Table 1 Comparison of eligible patients (22,462) and ineligible patients (3,545), 2006–2010
Figure 1 Mean LOS (±95% CI) of all COPD admissions (2006–2010) among patients aged ≥45 years and mean LOS (±95% CI) of patients aged ≥45 years admitted for the first time in at least 12 months (2006–2010).
Abbreviations: CI, confidence interval; LOS, length of stay.
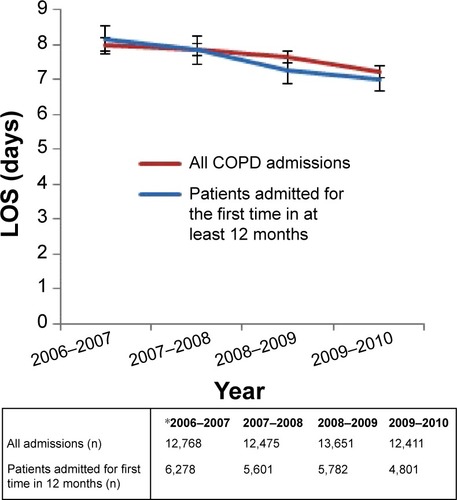
Figure 2 Mean LOS per COPD admission (±95% CI) among study patients not admitted for COPD during the preceding 12 months, plotted against mean time in days to that admission from their first admission in 2006–2007.
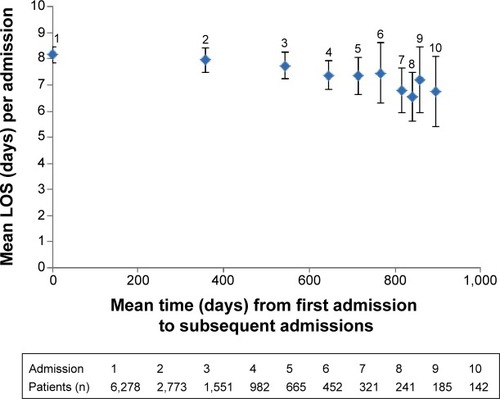
Figure 3 LOS (box and whisker plot of median, interquartile ranges, and outliers) of all COPD admissions (2006–2010) of patients registered with London general practices not having had a COPD admission in the 12 months prior to their first admission after April 1, 2006 to English hospitals reporting at least 100 such admissions.
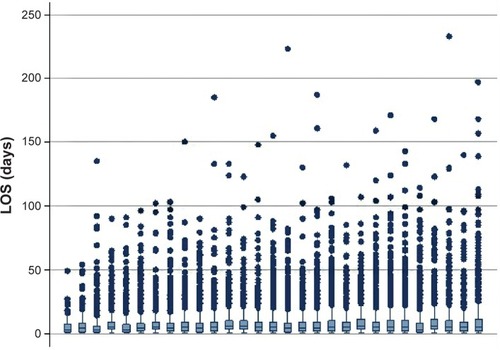
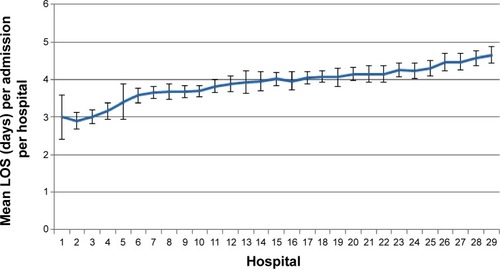
Figure 4 Mean LOS (±95% CI) of all COPD admissions (36,893) to included English hospitals between 2006–2010, and adjusted for clustering, age, sex, and geographical deprivation score of patients.
Abbreviations: CI, confidence interval; LOS, length of stay.
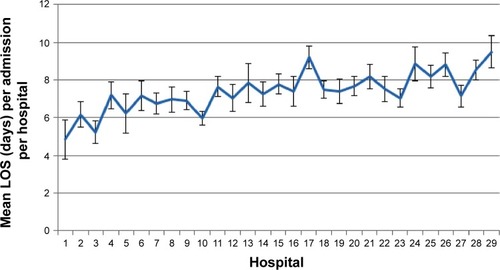
Figure 5 Mean LOS (±95% CI) of COPD admissions ≤10 days (29,255) to included English hospitals between 2006–2010, shown in ascending order and adjusted for clustering, age, sex, and geographical deprivation score of patients.
Abbreviations: CI, confidence interval; LOS, length of stay.
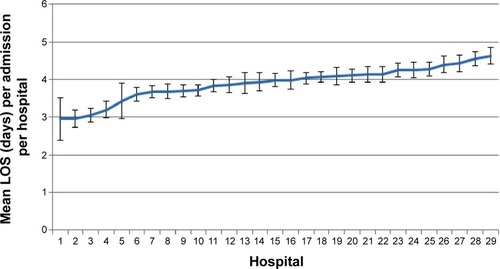
Figure 6 Mean LOS (±95% CI) of COPD admissions ≤10 days (27,813) to included English hospitals between 2006–2010, and adjusted for clustering, age, sex, and geographical deprivation score of patients.
Abbreviations: CI, confidence interval; LOS, length of stay.