Figures & data
Figure 1 Disposition of patients.
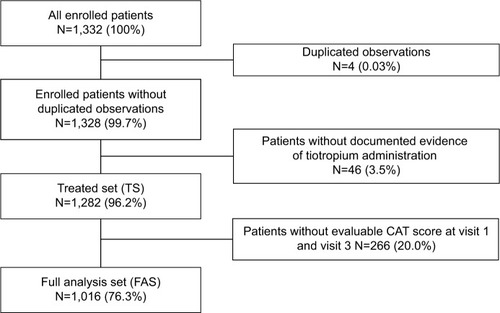
Table 1 Baseline characteristics – total FAS population and subgroups
Table 2 Concomitant therapy related to respiratory disorders by COPD subgroups (FAS)
Table 3 Concomitant medication
Figure 2 Overall CAT score at visit 1 and visit 3 by COPD stage – FAS.
Abbreviations: CAT, COPD Assessment Test; COPD, chronic obstructive pulmonary disease; FAS, full analysis set.
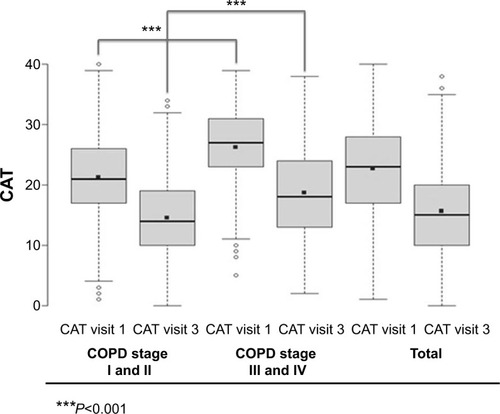
Figure 3 Change in the total CAT score at visit 3 from the baseline depending on COPD stage – FAS.
Abbreviations: CAT, COPD Assessment Test; COPD, chronic obstructive pulmonary disease; FAS, full analysis set.
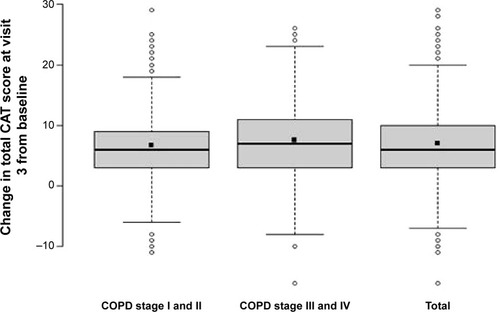
Figure 4 Maintenance or improvement of health and COPD status (measured by CAT) depending on COPD stage – FAS.
Abbreviations: COPD, chronic obstructive pulmonary disease; CAT, COPD Assessment Test; FAS, full analysis set.
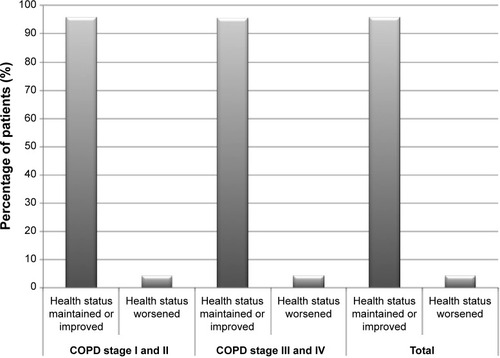
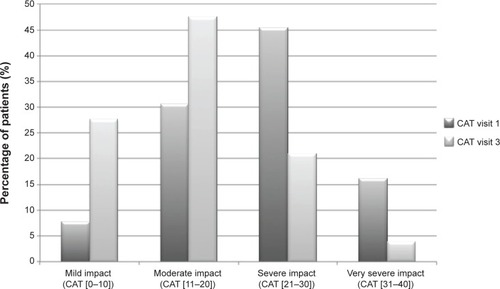
Figure 5 Impact of COPD on patients’ health status at the baseline and after 3 months of tiotropium treatment – FAS.
Abbreviations: CAT, COPD Assessment Test; COPD, chronic obstructive pulmonary disease; FAS, full analysis set.