
Figures & data
Table 1 Inclusion and exclusion criteria for COPD patients
Table 2 Inclusion and exclusion criteria for normal control subjects
Table 3 Characteristics of all subjects
Table 4 CAT score and CT measurements in the total subjects
Figure 1 Positive correlation between the CAT score and %LAA–950.
Notes: r=0.46, P=0.000.
Abbreviations: %LAA–950, percentage of pixels below −950 HU; CAT, chronic obstructive pulmonary disease assessment test.
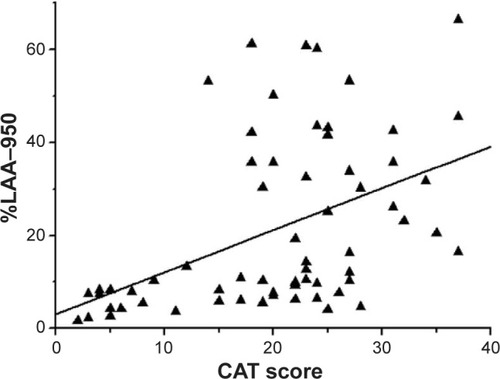
Figure 2 Positive correlation between the CAT score and %WA.
Notes: r=0.48, P=0.000.
Abbreviations: %WA, wall area percentage; CAT, chronic obstructive pulmonary disease assessment test.
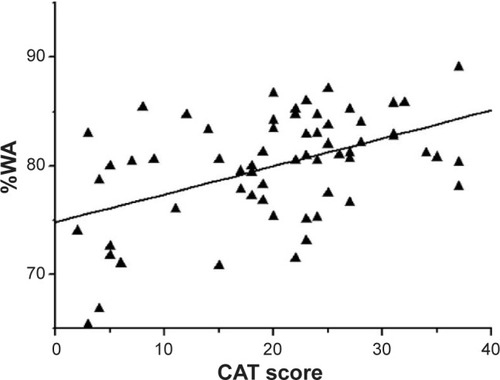
Figure 3 Positive correlation between the CAT score and WT/D.
Notes:
r=0.37, P=0.003.
Abbreviations: CAT, chronic obstructive pulmonary disease assessment test; WT/D, ratio of airway wall thickness to total diameter.
Abbreviations: CAT, chronic obstructive pulmonary disease assessment test; WT/D, ratio of airway wall thickness to total diameter.
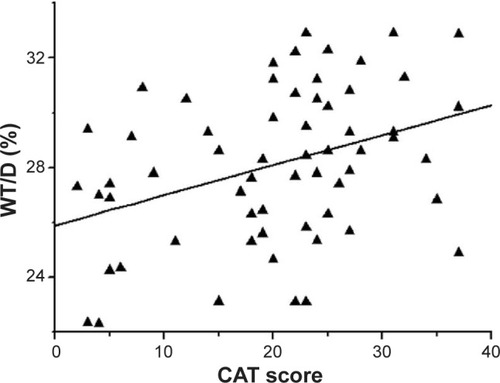
Table 5 CT measurements in different CAT groups