Figures & data
Figure 1 Blood concentrations of (A) neutrophils, (B) MPO protein, (C) NE protein, and (D) CRP in smokers with OPD-CB, AS, and NS during a clinically stable period at the time of inclusion.
Notes: The data are presented both as individual (dots) and median (bold lines) values (*P<0.05, Kruskal–Wallis test followed by the Mann–Whitney U-test, n=10 [never-smokers and asymptomatic smokers], n=60 [OPD-CB]).
Abbreviations: AS, asymptomatic smokers; CRP, C-reactive protein; MPO, myeloperoxidase; NE, neutrophil elastase; NS, never-smokers; OPD-CB, obstructive pulmonary disease and chronic bronchitis.
![Figure 1 Blood concentrations of (A) neutrophils, (B) MPO protein, (C) NE protein, and (D) CRP in smokers with OPD-CB, AS, and NS during a clinically stable period at the time of inclusion.Notes: The data are presented both as individual (dots) and median (bold lines) values (*P<0.05, Kruskal–Wallis test followed by the Mann–Whitney U-test, n=10 [never-smokers and asymptomatic smokers], n=60 [OPD-CB]).Abbreviations: AS, asymptomatic smokers; CRP, C-reactive protein; MPO, myeloperoxidase; NE, neutrophil elastase; NS, never-smokers; OPD-CB, obstructive pulmonary disease and chronic bronchitis.](/cms/asset/b34ab77a-5a3d-4652-b652-55ea15e17a03/dcop_a_77274_f0001_b.jpg)
Figure 2 Correlations between (A) blood concentrations of MPO protein and neutrophils (ρ=0.38, P<0.05, Spearman rank correlation) and (B) blood concentrations of NE protein and neutrophils (ρ=0.38, P<0.05, Spearman rank correlation) of smokers with obstructive pulmonary disease and chronic bronchitis (n=34) during a clinically stable period at the time of inclusion.
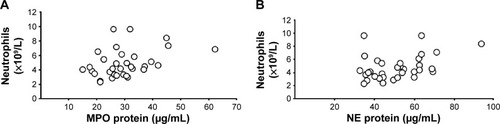
Figure 3 Correlations between (A) blood concentrations of MPO and NE protein (ρ=0.72, P<0.001, Spearman rank correlation) and (B) levels of mRNA for MPO and NE in blood leukocytes (r=0.85, P<0.001, Spearman rank correlation) in smokers with obstructive pulmonary disease and chronic bronchitis (n=34) during a clinically stable period at the time of inclusion.
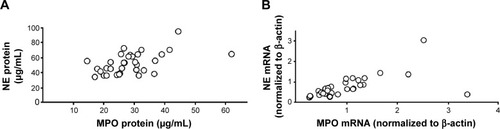
Table 1 Circulating markers of inflammation in smokers with OPD-CB
Table 2 Characteristics of smokers with OPD-CB and low transcutaneous oxygen during exacerbations
Figure 4 Blood concentrations of MPO protein before, during, and after exacerbations in smokers with obstructive pulmonary disease and chronic bronchitis (n=38).
Notes: The data are presented as individual (circles) and median (bold lines) values (*) P<0.05; Mann Whitney U-test).
Abbreviations: EXA, exacerbation; MPO, myeloperoxidase.
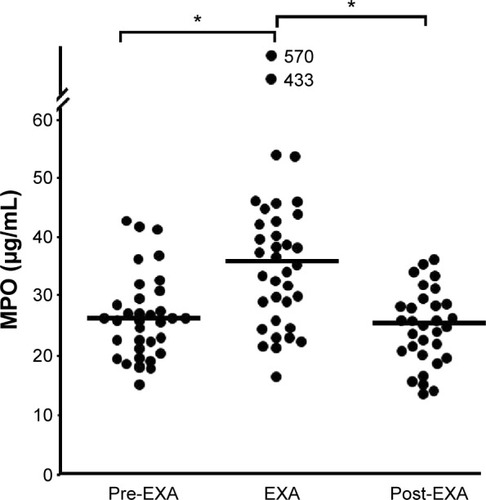
Figure 5 Correlations between (A) blood concentrations of MPO and NE protein (ρ=0.4, P<0.05, Spearman rank correlation) and (B) levels of MPO and NE mRNA in blood leukocytes (ρ=0.89, P<0.001, Spearman rank correlation) from smokers with obstructive pulmonary disease and chronic bronchitis (n=34) during exacerbations. The data are presented as individual values.
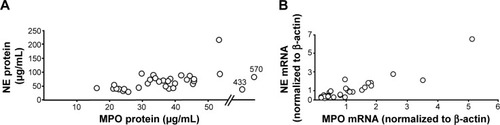
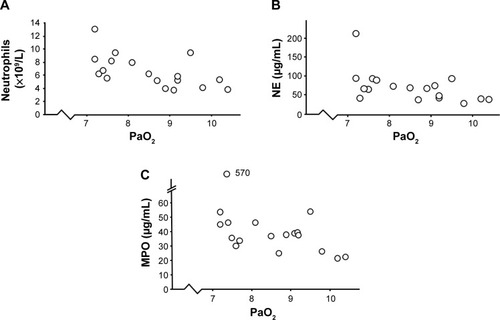
Figure 6 Correlations between oxygen saturation and signs of systemic inflammation in smokers with obstructive pulmonary disease and chronic bronchitis (n=18) who displayed transcutaneous hypoxia during exacerbations.
Abbreviations: MPO, myeloperoxidase; NE, neutrophil elastase; PaO2, partial oxygen pressure.