
Figures & data
Figure 1 The frequency distributions of the annual change in SGRQ (units/year).
Abbreviation: SGRQ, St George’s Respiratory Questionnaire; SD, standard deviation.
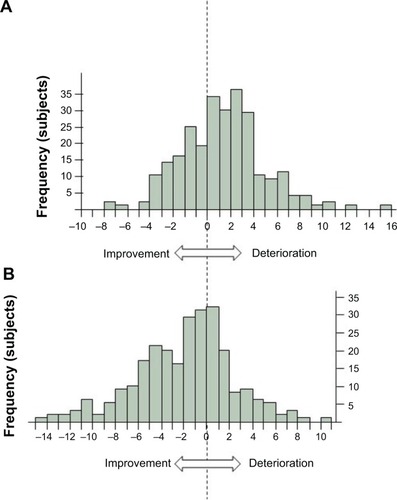
Figure 2 The relationship between the annual change in postbronchodilator FeV1.
Abbreviations: FEV1, forced expiratory volume in 1 second; SGRQ, St George’s Respiratory Questionnaire.
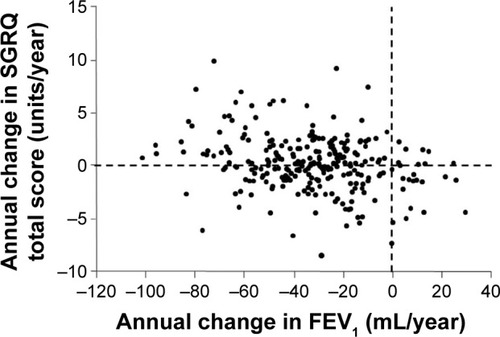
Figure 3 The changes in the total and three component scores of the SGRQ during follow-up.
Abbreviations: FEV1, forced expiratory volume in 1 second; SGRQ, St George’s Respiratory Questionnaire; ΔSGRQ, change from baseline in the SGRQ; SE, standard error.
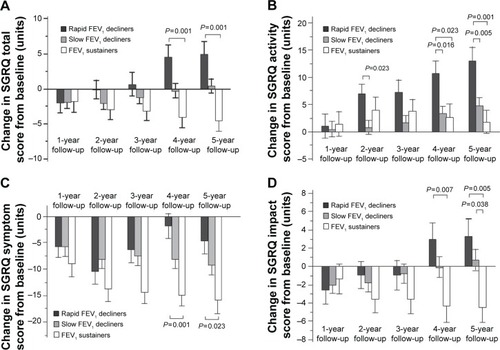
Table 1 Annual changes in the total and three component scores of SGRQ classified by annual rates of decline in FEV1 during follow-up
Table 2 Results of unadjusted and adjusted linear mixed-effects models to identify which variables at baseline were predictive of the annual change in SGRQ activity and symptom scores at 5 years
Table 3 Results of linear mixed-effects models to identify which variables during follow-up were predictive of the annual change in SGRQ activity scores at 5 years
Table 4 Results of linear mixed-effects models to identify which variables during follow-up were predictive of the annual change in SGRQ symptom scores at 5 years
Figure S1 The frequency distributions of the annual change in SGRQ.
Note: The calculated annual change in the SGRQ total score (units/year) is 0.06 ± 2.64 (mean ± SD).
Abbreviation: SGRQ, St George’s Respiratory Questionnaire.
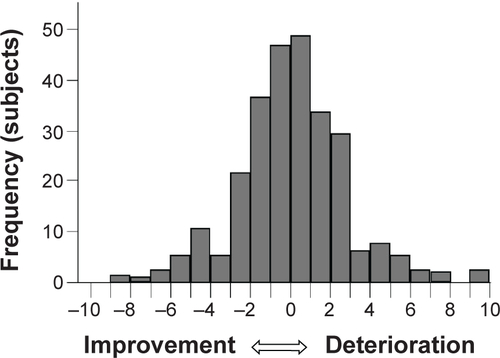
Table S1 Clinical characteristics of phenotypes between the follow-up group and dropouts at baseline
Table S2 Characteristics of subjects with COPD classified by annual rates of decline in FEV1 at baseline
Table S3 Characteristics of subjects with COPD classified by annual rates of decline in FEV at baseline
Table S4 Results of unadjusted and adjusted linear mixed-effects models to identify which variables at baseline were predictive of the annual change in SGRQ total scores at 5 years
Table S5 Results of unadjusted and adjusted linear mixed-effects models to identify which variables at baseline were predictive of the annual change in SGRQ impact scores at 5 years
Table S6 Results of linear mixed-effects models to identify which variables during follow-up were predictive of the annual change in SGRQ total scores at 5 years
Table S7 Results of linear mixed-effects models to identify which variables during follow-up were predictive of the annual change in SGRQ impact scores at 5 years