
Figures & data
Figure 1 Cigarette smoke (CS)-induced pigment epithelium-derived factor (PEDF) expression both in vitro and in vivo.
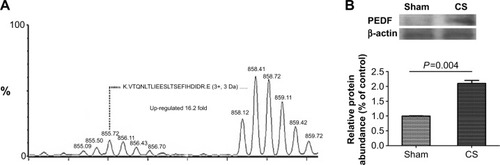
Table 1 Characteristics of healthy volunteers and COPD patients in stable condition
Figure 2 Levels of pigment epithelium-derived factor (PEDF) in the plasma from the healthy nonsmokers group, healthy smokers group, and chronic obstructive pulmonary disease (COPD) group. Circulating PEDF concentrations were measured using multiplex enzyme-linked immunosorbent assay. COPD patients had a significantly elevated PEDF level when compared with those of the healthy nonsmoker and smoking subjects (P=0.0001 and P=0.0477, respectively). There was no difference between the healthy nonsmokers and smokers (P=0.2712). The expression of PEDF is presented as the median (interquartile range) and compared by one-way analysis of variance. A value of P<0.05 was considered to be statistically significant.
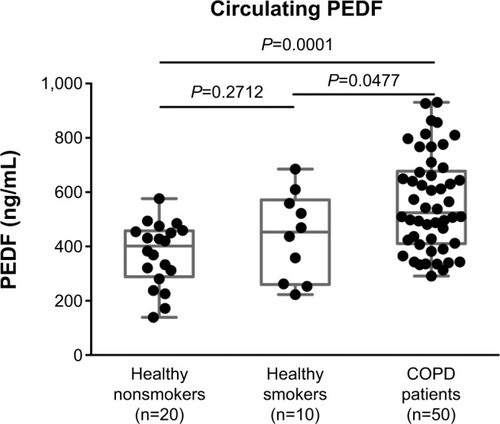
Figure 3 Circulating pigment epithelium-derived factor (PEDF) levels were correlated with established chronic obstructive pulmonary disease (COPD) biomarkers. PEDF concentration was positively correlated with (A) serum C-reactive protein (CRP) (r=0.4294; P<0.0001); (B) interleukin (IL)-8 (r=0.2947; P=0.0080); (C) tumor necrosis factor (TNF)-α (r=0.2665; P=0.0169); and (D) IL-6 (r=0.3433; P=0.018). (E, F) The absolute value of PEDF was also correlated with either neutrophil number or neutrophil percentage (r=0.3086, P=0.0054; r=0.2202, P=0.0497, respectively). The solid line denotes the line of best fit, and Pearson’s correlation coefficient is presented as an r-value.
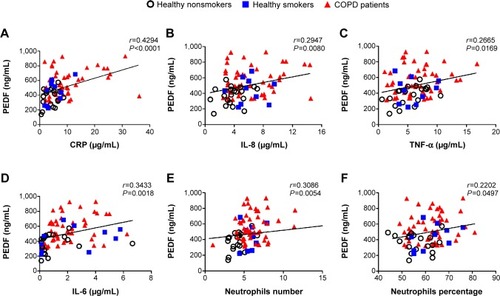
Table 2 Spirometry results of healthy volunteers and COPD patients in stable condition
Figure 4 Correlation analysis between PEDF levels and pulmonary function.
Abbreviations: PEDF, pigment epithelium-derived factor; FEV1, forced expiratory volume in 1 second; FVC, forced vital capacity; COPD, chronic obstructive pulmonary disease.
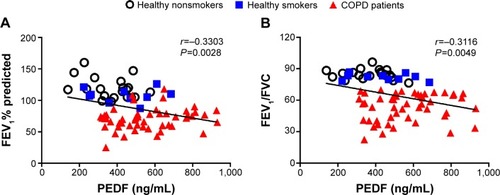
Table 3 Multivariable linear regression analysis for circulating PEDF in volunteers and COPD patients