Figures & data
Table 1 Pulmonary rehabilitation compared to usual care in COPD with mild symptoms
Figure 1 Flow diagram showing the selection process of material from identification to inclusion.
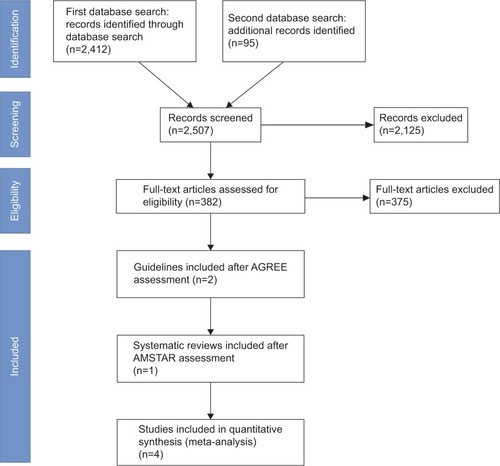
Table 2 Baseline characteristics of the included studies
Table 3 Dropout characteristics
Figure 2 Risk of bias summary: the review authors’ evaluations of each risk of bias item for each included study.
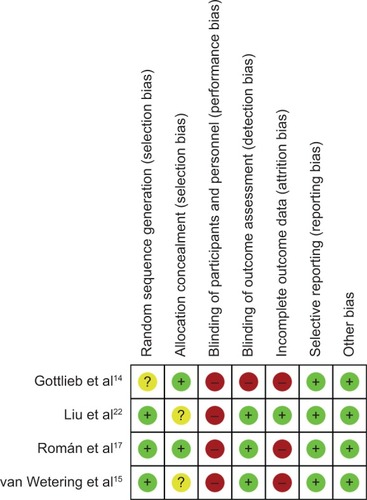
Figure 3 PR versus usual care: short-term evaluation of health-related quality of life measured by St George’s Respiratory Questionnaire.
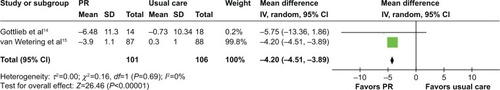
Figure 4 PR versus usual care: evaluation of health-related quality of life measured on St George’s Respiratory Questionnaire at the longest follow-up (18–24 months from baseline).
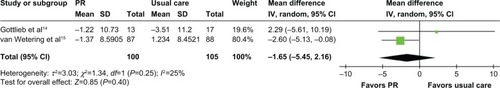
Figure 5 PR versus usual care: walking distance (6-minute walking distance).
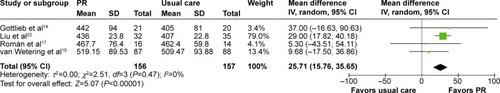
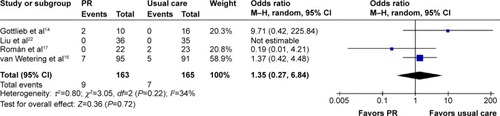
Figure 6 PR versus usual care: mortality, odds ratio.