
Figures & data
Table 1 Characteristics of 160 patients with COPD enrolled in the study
Figure 1 Schematic diagram of randomization.
Abbreviations: COPD, chronic obstructive pulmonary disease; CAT, COPD Assessment Test.
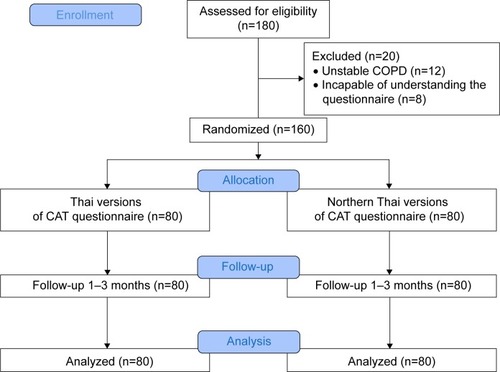
Table 2 Cross-sectional validity between each domain of CAT and SGRQ at the patients’ first visit
Figure 2 Correlation between SGRQ and CAT scores.
Notes: (A) Thai version (r=0.60, P<0.001) (B) Northern Thai dialect version (r=0.77, P<0.001).
Abbreviations: SGRQ, St George’s Respiratory Questionnaire; CAT, COPD Assessment Test.
Abbreviations: SGRQ, St George’s Respiratory Questionnaire; CAT, COPD Assessment Test.
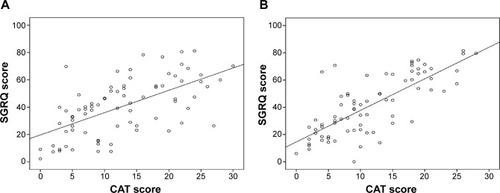
Table 3 Correlations between each domain of CAT and concurrent measures of disease severity
Table S1 Thai version
Table S2 Northern Thai dialect version