Figures & data
Figure 1 Flow chart for selecting study participants.
Abbreviations: ACOS, asthma–chronic obstructive pulmonary disease overlap syndrome; COPD, chronic obstructive pulmonary disease; GOLD, Global Initiative for Chronic Obstructive Lung Disease.
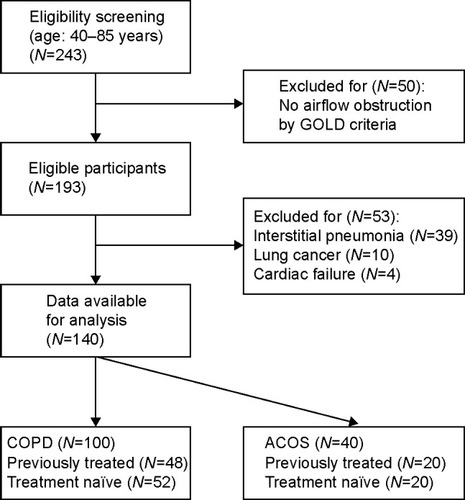
Table 1 Patients characteristics
Figure 2 Comparison of CAT scores between COPD and ACOS patients.
Notes: Results for CAT scores were compared between ACOS and COPD patients by Mann–Whitney U-tests. Bars indicate standard errors.
Abbreviations: ACOS, asthma–chronic obstructive pulmonary disease overlap syndrome; CAT, chronic obstructive pulmonary disease assessment test; COPD, chronic obstructive pulmonary disease.
Abbreviations: ACOS, asthma–chronic obstructive pulmonary disease overlap syndrome; CAT, chronic obstructive pulmonary disease assessment test; COPD, chronic obstructive pulmonary disease.
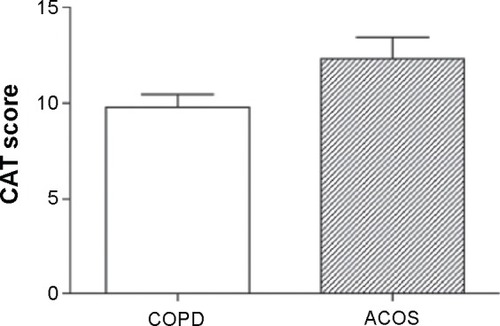
Figure 3 Comparison of radiological variable results between COPD and ACOS patients.
Notes: Results for radiological variables were compared between ACOS and COPD patients by Mann–Whitney U-tests. Bars indicate standard errors.
Abbreviations: ACOS, asthma–chronic obstructive pulmonary disease overlap syndrome; COPD, chronic obstructive pulmonary disease; %CSA <5, percentage of total cross-sectional area of pulmonary vessels less than 5 mm2; LAV%, percentage of low attenuation volume; WA%, percentage of wall area.
Abbreviations: ACOS, asthma–chronic obstructive pulmonary disease overlap syndrome; COPD, chronic obstructive pulmonary disease; %CSA <5, percentage of total cross-sectional area of pulmonary vessels less than 5 mm2; LAV%, percentage of low attenuation volume; WA%, percentage of wall area.
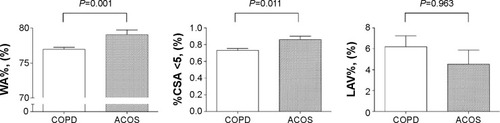
Table 2 Characteristics of the ACOS patients treated with budesonide/formoterol
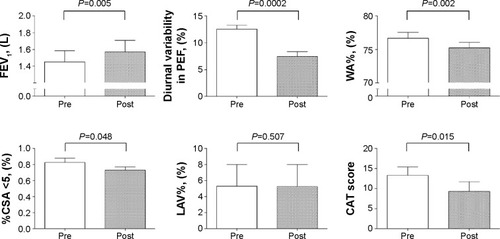
Figure 4 Changes in clinical variables after treatment with inhaled budesonide/formoterol.
Notes: Results for pulmonary function parameters, radiological parameters, and CAT scores were compared between pretreatment and 3 months after therapy with budesonide/formoterol using nonparametric Wilcoxon rank sum tests. Bars indicate standard errors.
Abbreviations: CAT, chronic obstructive pulmonary disease assessment test; %CSA <5, percentage of total cross-sectional area of pulmonary vessels less than 5 mm2; FEV1, forced expiratory volume in 1 second; LAV%, percentage of low attenuation volume; PEF, peak expiratory flow; Post, 3 months after treatment with budesonide/formoterol; Pre, pretreatment with budesonide/formoterol; WA%, percentage of wall area.
Abbreviations: CAT, chronic obstructive pulmonary disease assessment test; %CSA <5, percentage of total cross-sectional area of pulmonary vessels less than 5 mm2; FEV1, forced expiratory volume in 1 second; LAV%, percentage of low attenuation volume; PEF, peak expiratory flow; Post, 3 months after treatment with budesonide/formoterol; Pre, pretreatment with budesonide/formoterol; WA%, percentage of wall area.