
Figures & data
Table 1 Baseline clinical and bacterial characteristics of subjects with and without PPM, on routine culture and by qPCR
Figure 1 Scatter correlation plot of sputum neutrophils (x-axis) with pathogen-specific bacterial load (y-axis) for samples above the limit of detection (qPCR LLD >1×10⁴ copies/mL of sputum).
Notes: Data were categorized into respective sputum culture pathogens (NSG, HI, MC, SP, and SA). (A) HI. (B) MC. (C) SP. (D) SA pathogen-specific qPCR. The horizontal dashed line on the y-axis related to pathogen-specific qPCR bacterial load of 106. The vertical dashed line on the x-axis related to sputum neutrophil count at 60% (neutrophilic airway inflammation).
Abbreviations: NSG, nonsignificant growth; HI, Haemophilus influenzae; LLD, lower limit of detection; MC, Moraxella catarrhalis; qPCR, quantitative real-time polymerase chain reaction; SP, Streptococcus pneumoniae; SA, Staphylococcus aureus.
Abbreviations: NSG, nonsignificant growth; HI, Haemophilus influenzae; LLD, lower limit of detection; MC, Moraxella catarrhalis; qPCR, quantitative real-time polymerase chain reaction; SP, Streptococcus pneumoniae; SA, Staphylococcus aureus.
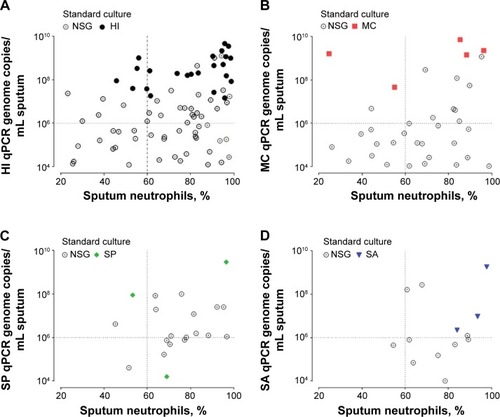
Table 2 Clinical and inflammatory characteristics of COPD patients with positive qPCR categorized into absent (<106), present (between 106 to 107), and highly present (greater than 108 copies/mL)
Table 3 Frequency of sputum PPM detection in culture or qPCR, in 65 COPD subjects with repeated sampling over 12 months
Table 4 Clinical and inflammatory baseline characteristics in COPD subjects, with sputum sampling over 12 months