
Figures & data
Figure 1 Study design and cohort selection.
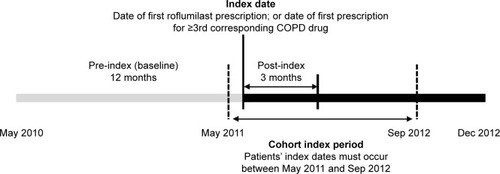
Figure 2 Flow chart of patient selection.
Abbreviation: ICD-9, International Classification of Diseases, Ninth Revision.
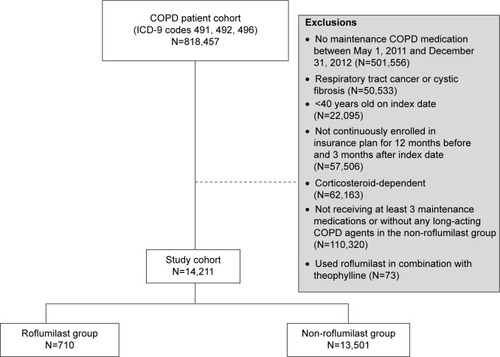
Table 1 Demographic and clinical characteristics at baseline
Figure 3 Monthly chronic obstructive pulmonary disease exacerbations: (A) total exacerbations, (B) severe exacerbations, (C) moderate exacerbations.
Notes: Baseline refers to monthly exacerbation rate during the 12-month preindex period; follow-up refers to monthly exacerbation rate during the 3-month follow-up period.
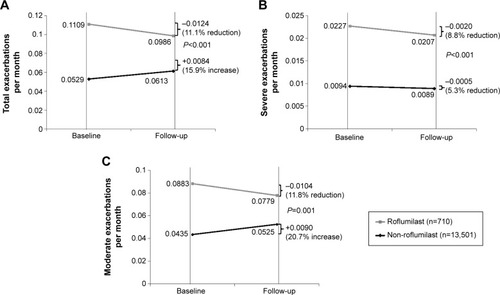
Table 2 Monthly health care resource utilization
Table 3 Monthly total health care costs ($)
Table S1 Monthly total health care costs and cost by component ($)