Figures & data
Table 1 Baseline demographic and disease characteristics of randomized patients in the ITT (N=1,352) population
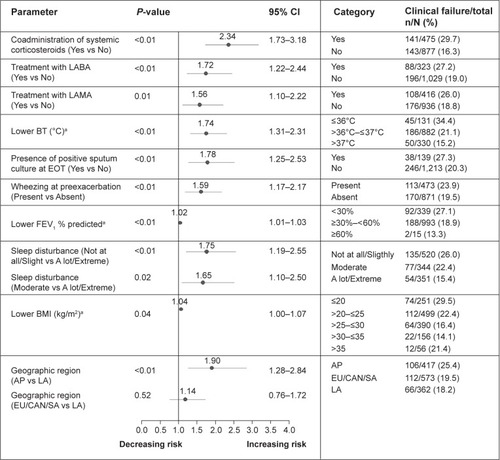
Figure 1 Prognostic factors associated with increased risk of clinical failure at EOT based on multivariate analysis.
Notes: Odds ratio is shown with horizontal line presentation of 95% CI. aContinuous variable.
Abbreviations: BT, body temperature; CI, confidence interval; EOT, end of therapy; LAMA, long-acting anticholinergic; N, number of patients in category; n, number of patients with clinical failures.
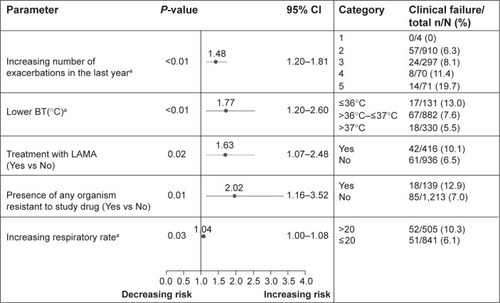
Figure 2 Prognostic factors associated with increased risk of clinical failure at 8 weeks posttherapy based on multivariate analysis.
Notes: Odds ratio is shown with horizontal line presentation of 95% CI. aContinuous variable.
Abbreviations: AP, Asia Pacific; BMI, body mass index; BT, body temperature; CAN, Canada; CI, confidence interval; EOT, end of therapy; EU, Europe; FEV1, forced expiratory volume in 1 second; LA, Latin America; LABA, long-acting β2-agonist; LAMA, long-acting anticholinergic; N, number of patients in category; n, number of patients with clinical failures; SA, South Africa.
Abbreviations: AP, Asia Pacific; BMI, body mass index; BT, body temperature; CAN, Canada; CI, confidence interval; EOT, end of therapy; EU, Europe; FEV1, forced expiratory volume in 1 second; LA, Latin America; LABA, long-acting β2-agonist; LAMA, long-acting anticholinergic; N, number of patients in category; n, number of patients with clinical failures; SA, South Africa.