Figures & data
Table 1 Clinical and functional characteristics of the studied patients
Table 2 Induced sputum cells in mild and moderate COPD subjects
Figure 1 Venn-diagram showing the percentage distribution of bronchial reversibility, bronchial hyperresponsiveness, and sputum eosinophilia in the COPD subjects enrolled in the study.
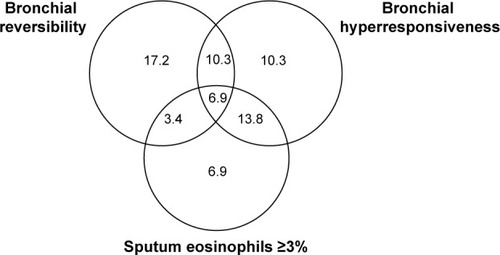
Table 3 BHR, reversibility, symptom score, and exacerbations in COPD patients considered altogether and divided according to sputum eosinophils
Figure 2 Correlation between the cumulative dose of methacholine (PD20) and the score of COPD symptoms questionnaire (rs=−0.76, P=0.005) (A), and the number of exacerbations in the previous year (rs=−0.59, P=0.021) (B).
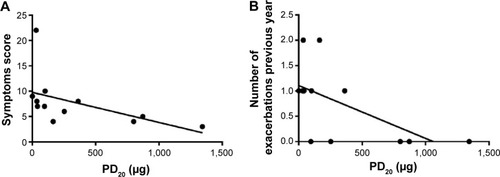
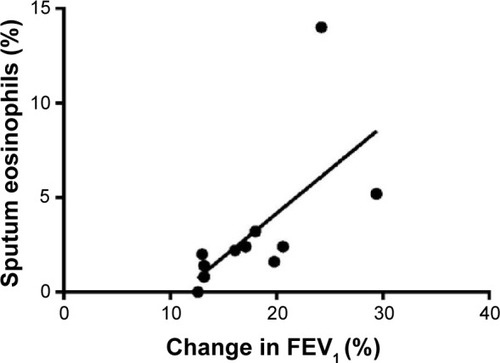
Figure 3 Correlation between changes in post-bronchodilator FEV1 (% baseline) and sputum eosinophils (%) (rs=0.82, P=0.003).