Figures & data
Figure 1 Flow diagram showing the participation of the patients in the study.
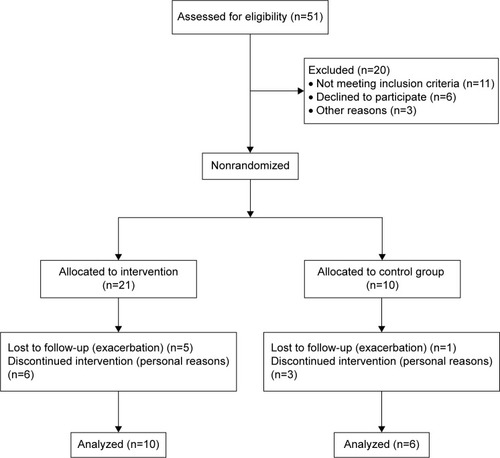
Figure 2 Time spent in each intensity zone during the 12 weeks of aerobic training.
Abbreviation: VO2peak, peak oxygen uptake.
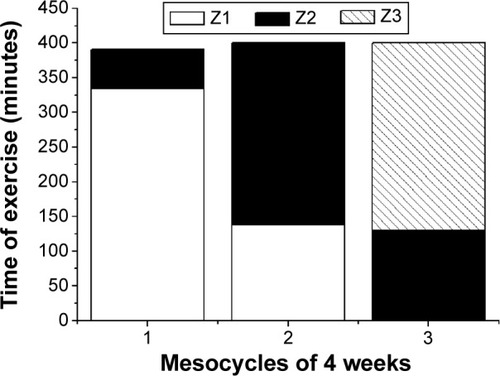
Table 1 Anthropometric data and pulmonary function of the assessed patients expressed in median (interquartile range 25%–75%)
Table 2 Aerobic parameters of aerobic training group (AT) and control group (CG), observed at baseline (M0) and after 12 weeks (M1) expressed in median (interquartile range 25%–75%)
Table 3 Heart rate variability indexes of aerobic training group (AT) and control group (CG), observed at baseline (M0) and after 12 weeks (M1) expressed in median (interquartile range 25%–75%)
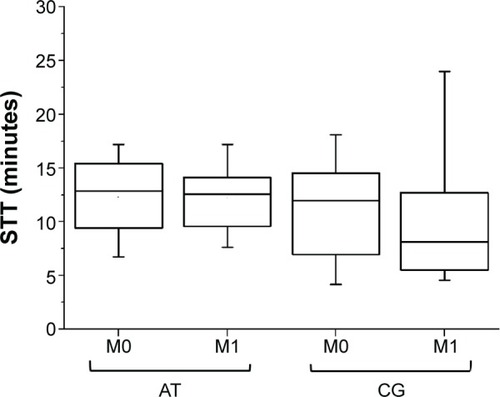
Figure 3 Box plot of saccharin transit time (STT) test of the aerobic training group (AT) and the no-training control group (CG), observed at baseline (M0) and after 12 weeks (M1).