Figures & data
Figure 1 Experimental design.
Note: *Randomized order.
Abbreviation: PFT, pulmonary function tests.
Abbreviation: PFT, pulmonary function tests.
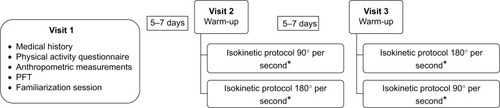
Table 1 Subject characteristics (n=14)
Table 2 Comparison between variables of the lower limb isokinetic endurance test at different angular velocities
Table 3 Test-retest reliability
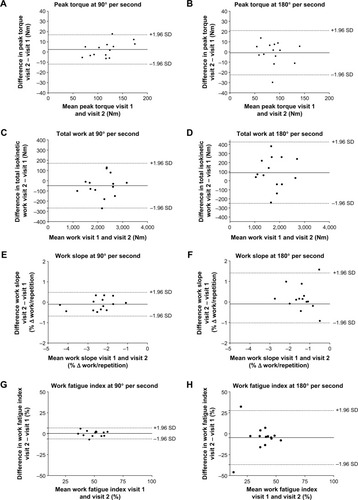
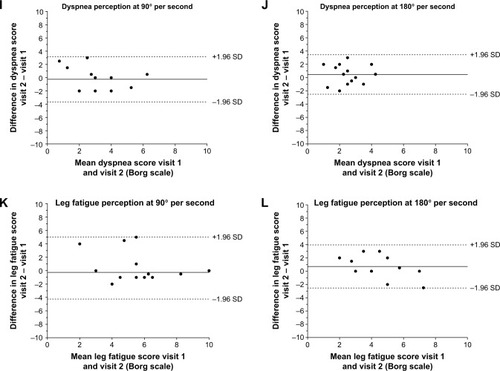
Figure 2 Bland-Altman plots.
Notes: llustration by Bland-Altman plots of means differences (solid lines) and 95% confidence intervals (dotted lines) of a 30-maximal repetition isokinetic muscle endurance procedure performed on two separate occasions for peak torque, total work, work slope, work fatigue, dyspnea perception, and leg fatigue perception. Left panels illustrate means differences and 95% confidence intervals for peak torque (A), total work (C), work slope (E), work fatigue (G), dyspnea perception (I), and leg fatigue perception (K) during isokinetic leg extension performed at 90°/s. The right panels illustrate means differences and 95% confidence intervals for peak torque (B), total work (D), work slope (F), work fatigue (H), dyspnea perception (J), and leg fatigue perception (L) during isokinetic leg extension performed at 180°/s.
Abbreviation: SD, standard deviation.
Abbreviation: SD, standard deviation.