
Figures & data
Table 1 Baseline characteristics of patients (n=46)
Figure 1 Monthly distribution of frequencies of COPD exacerbations for time of year and for pathogens.
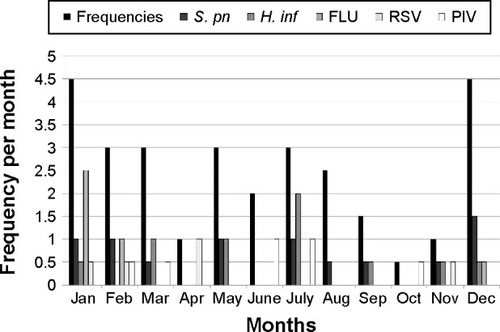
Table 2 Identity of pathogens in patients with COPD exacerbation
Figure 2 Percentages of pathogens underlying COPD exacerbations.
Abbreviations: COPD, chronic obstructive pulmonary disease; RSV, respiratory syncytial virus.
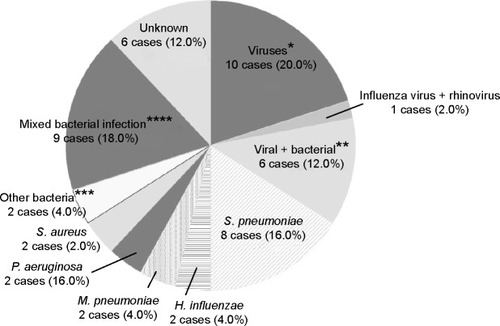
Figure 3 Box-and-whisker plots showing (A) white blood cell (WBC) count and (B) C-reactive protein (CRP) comparing the Streptococcus pneumoniae (S. pn) group, including isolated only S. pneumoniae infection (n=8) with Gram-negative bacilli (GNB) group, including enteric and nonfermenting GNB (n=11); the other bacteria (OthrBac) group, including Haemophilus influenzae, Mycoplasma pneumoniae, and Staphylococcus aureus (n=8); the V-B Mix group, including mixed viral and bacterial infection (n=6); the viral group (n=11); and the not determined (ND) group, in which no pathogen was detected (n=6). Data are presented as median (interquartile range).
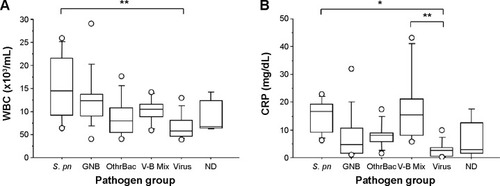
Table 3 Risk factors for prolonged hospitalization associated with COPD exacerbation
Table 4 Multivariate analysis of risk factors for prolonged hospitalization associated with COPD exacerbation