Figures & data
Table 1 Baseline characteristics of the patients at the inclusion visit
Figure 1 Flow chart of patients included in the study.
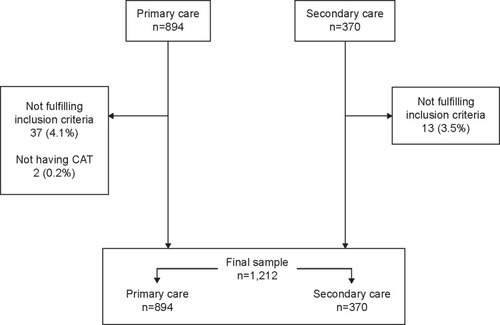
Figure 2 Relationship between spirometric impairment and the CAT score in the On-Sint cohort.
Abbreviations: CAT, COPD Assessment Test; GOLD, Global Initiative for Obstructive Lung Disease; NS, not significant; On-Sint, Clinical presentation, diagnosis, and course of chronic obstructive pulmonary disease study.
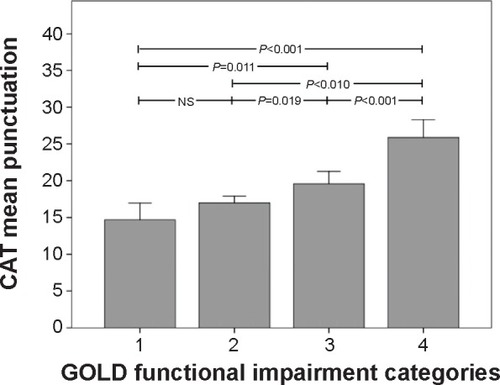
Figure 3 Relationship between the MRC dyspnea score and the CAT score, in the On-Sint cohort.
Abbreviations: CAT, COPD Assessment Test; MRC, modified Medical Research Council scale; NS, not significant; On-Sint, Clinical presentation, diagnosis, and course of chronic obstructive pulmonary disease study.
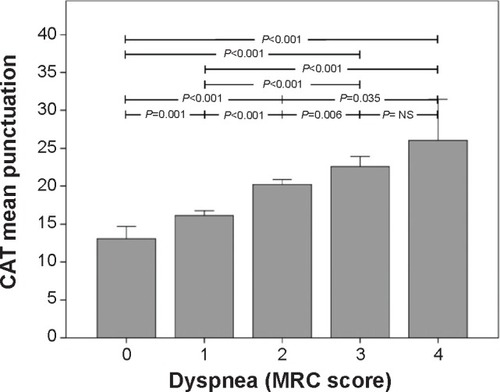
Figure 4 Relationship between the number of exacerbations and the CAT score, in the On-Sint cohort.
Abbreviations: CAT, COPD Assessment Test; On-Sint, Clinical presentation, diagnosis, and course of chronic obstructive pulmonary disease study.
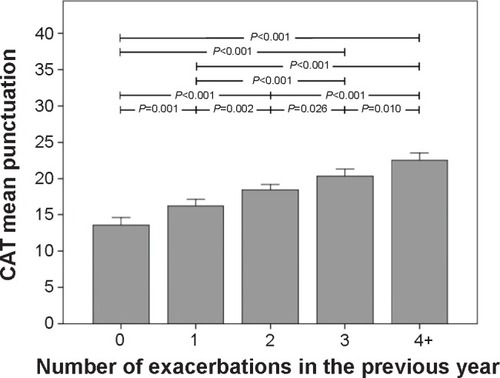
Figure 5 Relationship between the GOLD 2011 staging system and the CAT score, in the On-Sint cohort.
Note: Whiskers represent 95% confidence intervals. A = low risk, less symptoms; B = low risk, more symptoms; C = high risk, less symptoms; D = high risk, more symptoms.
Abbreviations: CAT, COPD Assessment Test; GOLD, Global Initiative for Obstructive Lung Disease; NS, not significant; On-Sint, Clinical presentation, diagnosis, and course of chronic obstructive pulmonary disease study.
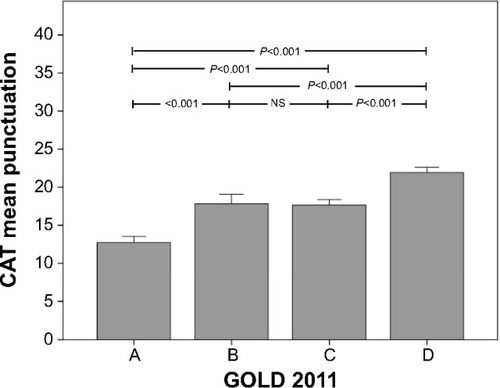
Figure 6 Distribution of the CAT score among the different modified GOLD 2011 classification.
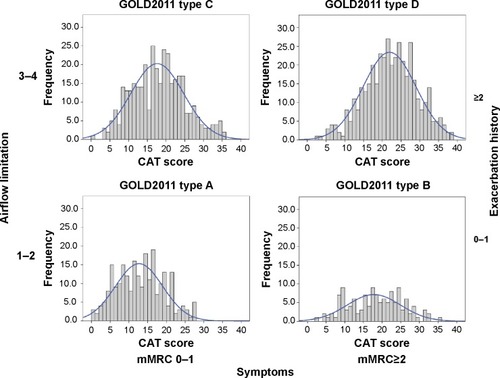
Table 2 Multivariate linear regression analysis to describe associations of GOLD axes and comorbidities with CAT
Table S1 Distribution of the included cases among Spanish regions, in the complete On-Sint cohort
Table S2 Relationship between the different comorbidities in the Charlson comorbidity index and the CAT score
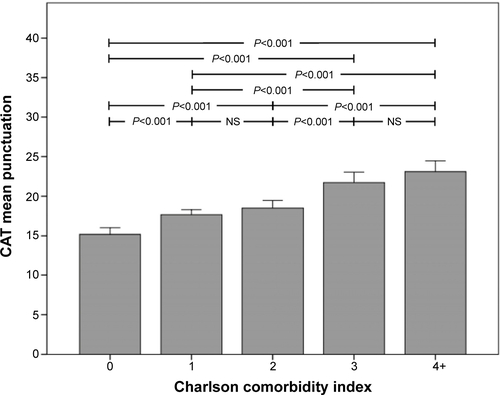
Figure S1 Relationship between the Charlson comorbidity index and the CAT score in the On-Sint cohort.
Note: Whiskers represent 95% confidence intervals.
Abbreviations: CAT, COPD assessment test; NS, not significant; On-Sint, Clinical presentation, diagnosis, and course of chronic obstructive pulmonary disease study.