Figures & data
Figure 1 Overview of the educational COPD intervention activities.
Notes:
#Follow-up checkups, COPD classes and patient meetings were conducted for persons with a definitive diagnosis of COPD and residents with potential COPD. *City publications were distributed to all households in Matsuura and open lectures for city residents were publicized among all residents in Matsuura, both of which could be viewed and/or attended. Adapted from Asai M, Tanaka T, Kozu R, et al. Effect of a COPD Intervention on COPD Awareness in a Regional City in Japan. Intern Med. 2015;54(2):163–169.Citation13
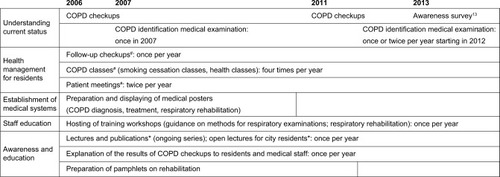
Table 1 Characteristics of the COPD screening target sample
Figure 2 Flowchart of the COPD screening and diagnosis procedure in Matsuura, Japan.
Abbreviations: 11-Q, eleven-item pre-interview questionnaire; FEV1, forced expiratory volume in 1 second; FVC, forced vital capacity.
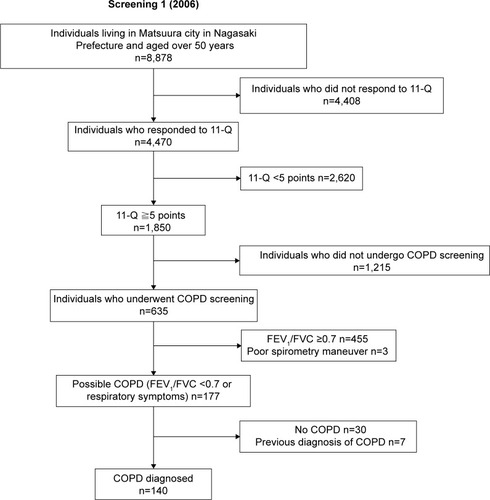
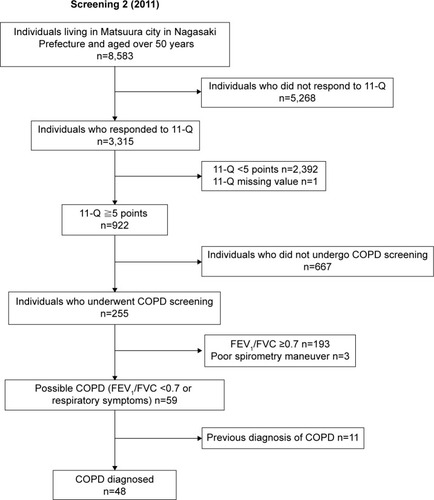
Figure 3 Prevalence of COPD in Matsuura, 2006.
Notes: (A) COPD prevalence for all Matsuura residents and subdivided by sex, (B) COPD prevalence by generation, (C) COPD prevalence by smoking status and BI score.
Abbreviation: BI, Brinkman Index.
Abbreviation: BI, Brinkman Index.
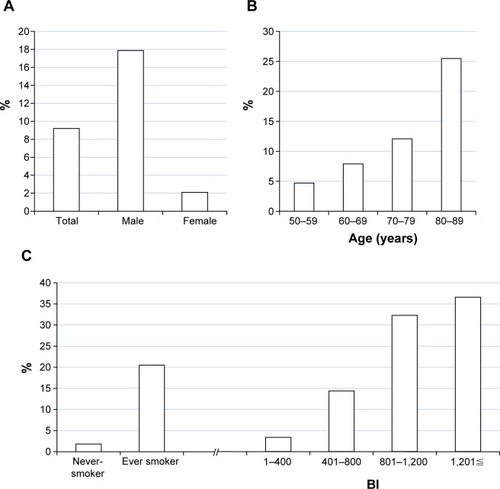
Figure 4 Number of newly diagnosed COPD patients each year from 2006 to 2014 in Matsuura.
Note: Gray represents newly enrolled patients, while white represents previously enrolled patients.
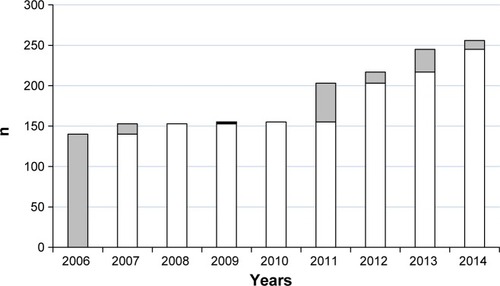
Figure 5 Comparison of the average cost of medical care for managing COPD in 10 years of one National Health Insurance member aged 50 years or older in Matsuura and in the rest of Nagasaki Prefecture.
Notes: The COPD medical costs were calculated for National Health Insurance members 50 years or older. The data of Matsuura are shown including a cost of the taskforce. The slanted line bar represents COPD medical costs per patient in the whole of Nagasaki Prefecture except Matsuura, and the dot bar represents the COPD medical costs in Matsuura.
Abbreviation: ns, not significant.
Abbreviation: ns, not significant.
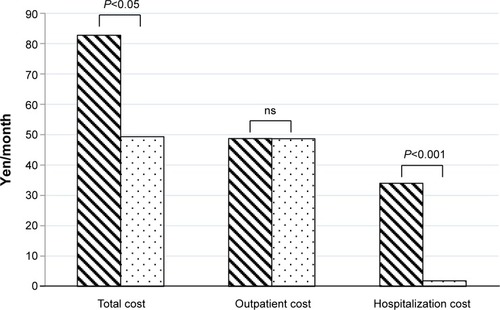
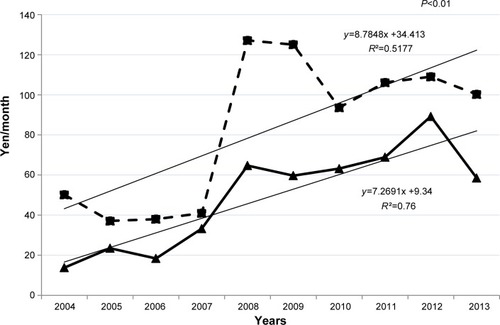
Figure 6 Comparison of average per capita National Health Insurance cost of COPD medical treatment in Matsuura and the rest of Nagasaki Prefecture in 50–80 year-old patients.
Notes: The data of Matsuura are shown including a cost of the taskforce. The solid line represents the medical costs in Matsuura, and the dashed line represents the medical costs in the rest of Nagasaki Prefecture. The straight lines are regression lines of these costs. Analysis of covariance demonstrated a significant difference between these two trends (P<0.01).