Figures & data
Table 1 Clinicopathological characteristics of the participants in this study
Table 2 Statistical analysis of the association between the rs712 polymorphism genotype and the presence of lung cancer in COPD patient
Figure 1 Schematic sequence comparison of KRAS 3′-UTR and primary let-7g and location of rs712 polymorphism in the 3′-UTR of KRAS.
Abbreviations: MUT, mutant; UTR, untranslated region; WT, wild-type.
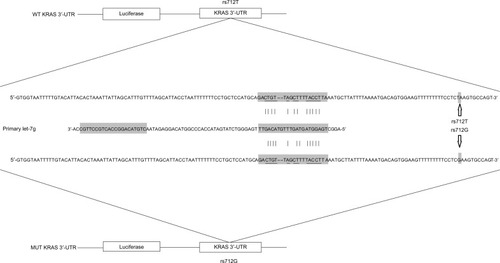
Figure 2 Evaluation of rs712 polymorphism on the interaction between let-7g and KRAS 3′-UTR.
Abbreviations: Luc, luciferase; WT, wild-type; UTR, untranslated region; Mut, mutant.
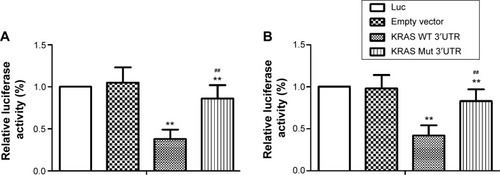
Figure 3 Determination of expression of KRAS in lungs of each genotype group by using immunohistochemistry.
Notes: Expression of KRAS was comparable between TT (A), TG (B), and GG (C) groups.
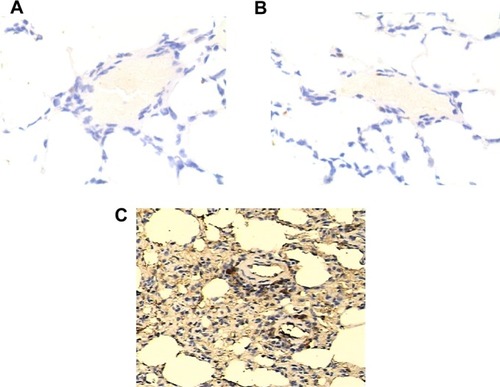
Figure 4 Determination of the expression of KRAS in each genotype group.
Notes: (A) Determination of expression of let-7g in lungs in each genotype group (TT, n=17; TG, n=12; GG, n=6) by using real-time PCR. (B) Determination of mRNA expression of KRAS in lungs in each genotype group (TT, n=17; TG, n=12; GG, n=6); (C) Determination of protein expression of KRAS in lungs in each genotype group (TT, n=17; TG, n=12; GG, n=6) by using Western blot. (D) Densitometry analysis of the results of Western blot (**P<0.01, compared with wild type, TT).
Abbreviation: PCR, polymerase chain reaction.
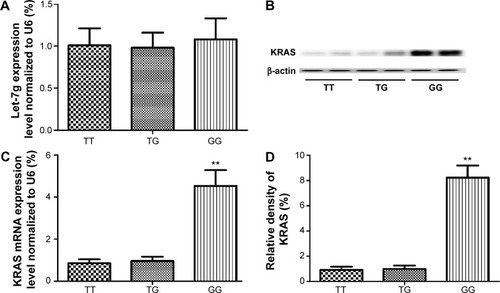
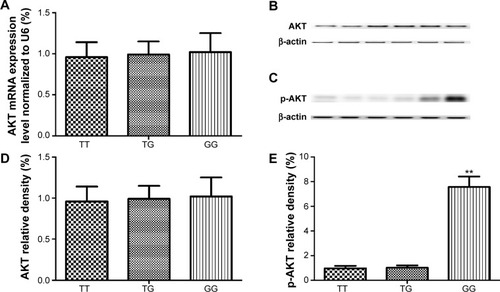
Figure 5 Determination of the expression levels and activities of total AKT and p-AKT in each genotype group.