Figures & data
Figure 1 Flow diagram of search strategy and study selection.
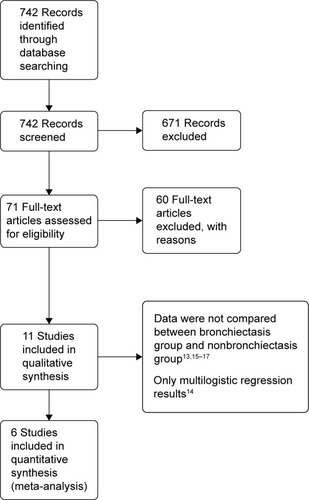
Table 1 Characteristics of included studies
Table 2 Radiological characteristics of COPD patients in the included studies
Table 3 Evaluation of quality of included studies
Figure 2 Forest plot of mean difference of age in COPD patients with and without bronchiectasis.
Abbreviations: CI, confidence interval; SD, standard deviation; COPD, chronic obstructive pulmonary disease; IV, inverse variance.
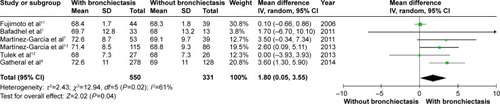
Figure 3 Forest plot of odds ratios of sex in COPD patients with and without bronchiectasis.
Abbreviations: CI, confidence interval; COPD, chronic obstructive pulmonary disease; M–H, Mantel-Haenszel method.
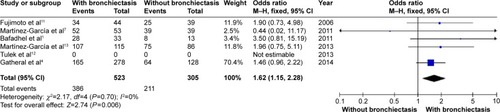
Figure 4 Forest plot of mean difference of smoking history (pack-years) in COPD patients with and without bronchiectasis.
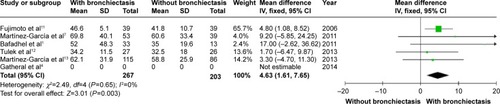
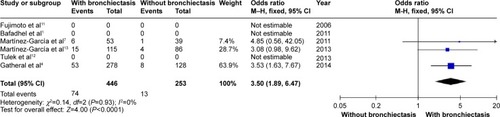
Figure 5 Forest plot of odds ratios of daily sputum production in COPD patients with and without bronchiectasis.
Abbreviations: CI, confidence interval; COPD, chronic obstructive pulmonary disease; M–H, Mantel-Haenszel method.
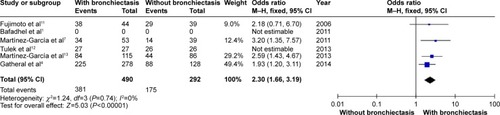
Figure 6 Forest plot of mean difference in exacerbations in COPD patients with and without bronchiectasis.
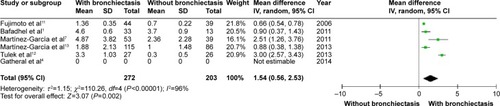
Figure 7 Forest plot of mean difference of postbronchodilator FEV1/FVC% in COPD patients with and without bronchiectasis.
Abbreviations: CI, confidence interval; COPD, chronic obstructive pulmonary disease; FEV1, forced expiratory volume in 1 second; FVC, forced vital capacity; IV, inverse variance; SD, standard deviation.
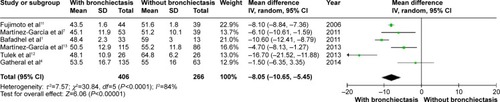
Figure 8 Forest plot of mean difference of postbronchodilator FEV1% predicted in COPD patients with and without bronchiectasis.
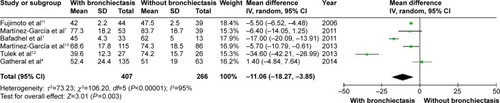
Figure 9 Forest plot of mean difference of CRP in COPD patients with and without bronchiectasis.
Abbreviations: CI, confidence interval; COPD, chronic obstructive pulmonary disease; CRP, C-reactive protein; IV, inverse variance; SD, standard deviation.
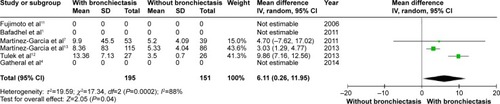
Figure 10 Forest plot of mean difference of albumin in COPD patients with and without bronchiectasis.
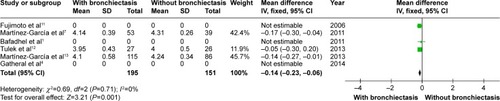
Figure 11 Forest plot of odds ratios of chronic PPM colonization in COPD patients with and without bronchiectasis.
Abbreviations: CI, confidence interval; COPD, chronic obstructive pulmonary disease; M–H, Mantel-Haenszel method; PPM, potentially pathogenic microorganisms.
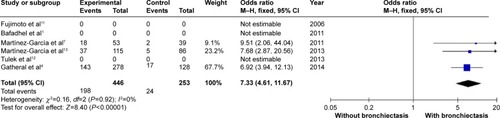
Figure 12 Forest plot of odds ratios of Pseudomonas aeruginosa isolation in COPD patients with and without bronchiectasis.