
Figures & data
Figure 1 The LANTERN study design.
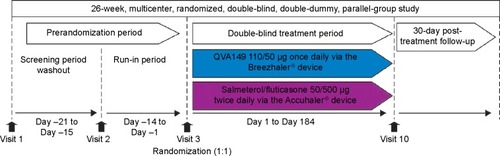
Figure 2 LANTERN trial profile.
Abbreviation: SFC, salmeterol/fluticasone.
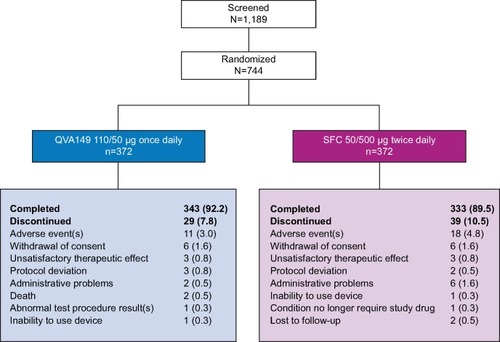
Table 1 Demographics and baseline patient characteristics
Table 2 Primary and secondary efficacy outcomes in the LANTERN study (full analysis set)
Figure 3 Trough FEV1 on day 1 and at weeks 12 and 26 (full analysis set).
Notes: Data are least square means ± standard error; *P<0.001.
Abbreviations: bid, twice daily; FEV1, forced expiratory volume in 1 second; od, once daily; SFC, salmeterol/fluticasone.
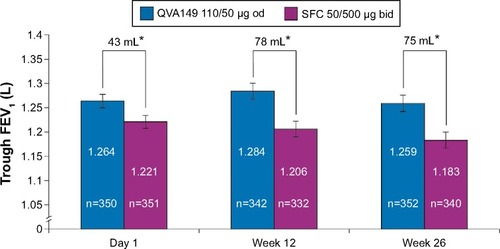
Figure 4 Forest plot of the treatment difference of trough FEV1 (L) at week 26 by smoking history, baseline ICS use, COPD severity, and age for QVA149 and SFC after 26 weeks of treatment (LOCF).
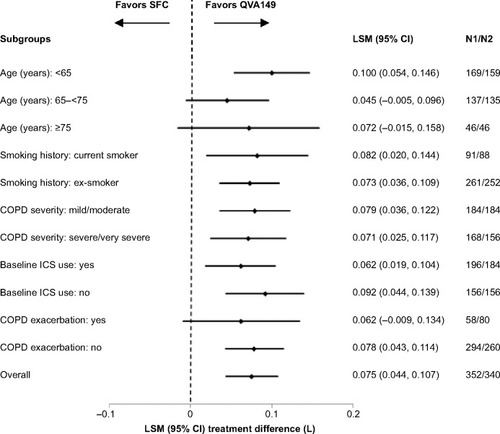
Table 3 Summary and analysis of COPD exacerbations over 26 weeks by treatment group (full analysis set)
Figure 5 Kaplan–Meier plots of the time to first moderate or severe COPD exacerbation over 26 weeks of treatment (full analysis set).
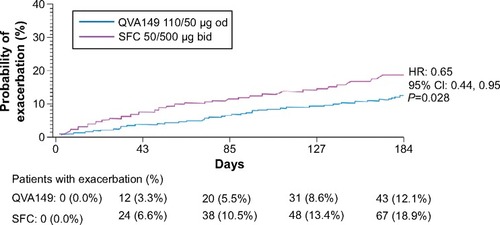
Table 4 Annualized rate of moderate or severe COPD exacerbation by baseline COPD exacerbation history
Table 5 Number (%) of AEs, SAEs, and deaths (safety set)