Figures & data
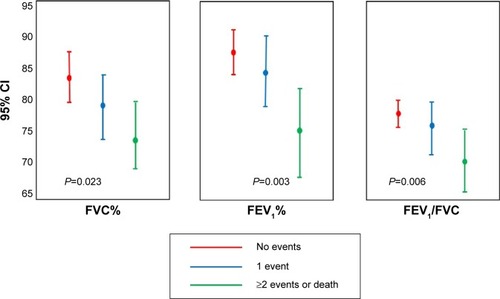
Figure 1 Flowchart of patients.
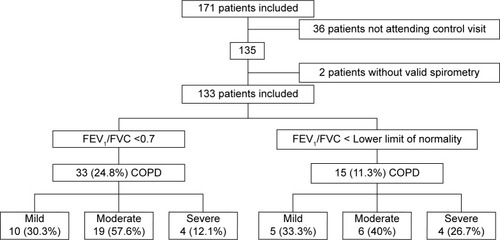
Table 1 Demographic and clinical characteristics of participants according to spirometry FEV1/FVC <0.70
Table 2 Characteristics of the PCI, according to spirometry FEV1/FVC <0.70
Table 3 Blood analysis of participants according to spirometry FEV1/FVC <0.70
Figure 2 Treatment at discharge and during patient follow-up.
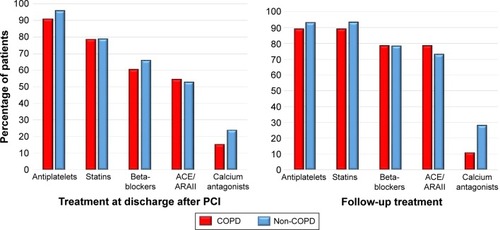
Table 4 Multivariate analysis by event using Cox regression
Figure 3 Kaplan–Meier survival curves for the mortality/major cardiovascular event variable (MACE).
Abbreviation: COPD, chronic obstructive pulmonary disease.
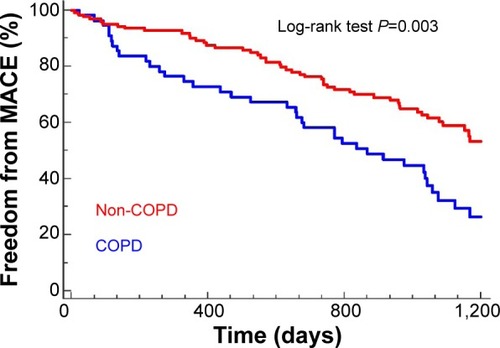
Figure 4 Kaplan–Meier curves for (A) Patients without prior diagnosis of COPD. (B) Total number of events by GOLD stage.
Abbreviations: COPD, chronic obstructive pulmonary disease; GOLD, Global initiative for chronic Obstructive Lung Disease; MACE, mortality/major cardiovascular event variable.
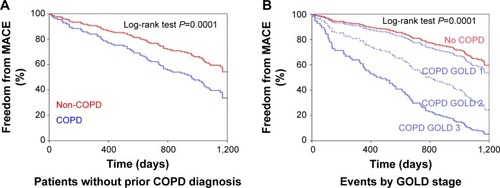
Figure 5 Hazard ratio and 95% CI for COPD by the fixed ratio and the LLN index both raw and adjusted by sex, age, number of arteries with stenosis, and history of AMI.
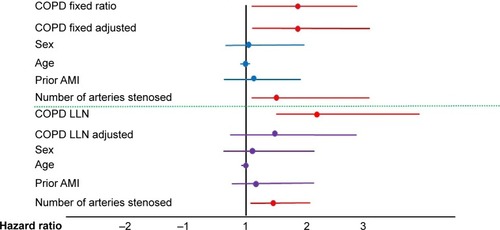
Figure 6 Relationship between number of events (MACE) and percent predicted FVC, FEV1, and FEV1/FVC.