
Figures & data
Table 1 Baseline characteristics of all COPD patients
Figure 1 Correlation between FEV1 and PEFR in patients with COPD.
Notes: (A) Correlation between % predicted FEV1 and % predicted PEFR (r=0.76, P<0.001); (B) correlation between absolute value of FEV1 and PEFR (r=0.87, P<0.001).
Abbreviations: FEV1, forced expiratory volume in 1 second; PEFR, peak expiratory flow rate.
Abbreviations: FEV1, forced expiratory volume in 1 second; PEFR, peak expiratory flow rate.
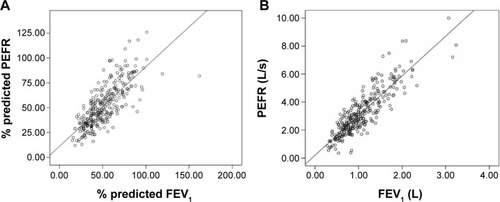
Table 2 Comparison between % predicted FEV1 and % predicted PEFR in each category of airflow limitation
Figure 2 Histogram showing the near-normal distribution of differences between % predicted FEV1 and PEFR in COPD patients.
Abbreviations: FEV1, forced expiratory volume in 1 second; PEFR, peak expiratory flow rate.
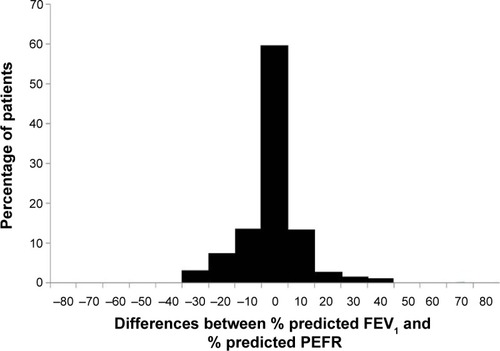
Figure 3 Bland–Altman plot highlighting magnitude of difference between % predicted FEV1 and PEFR.
Note: Horizontal dashed lines represent the mean bias and its 95% confidence limits. Abbreviations: FEV1, forced expiratory volume in 1 second; PEFR, peak expiratory flow rate.
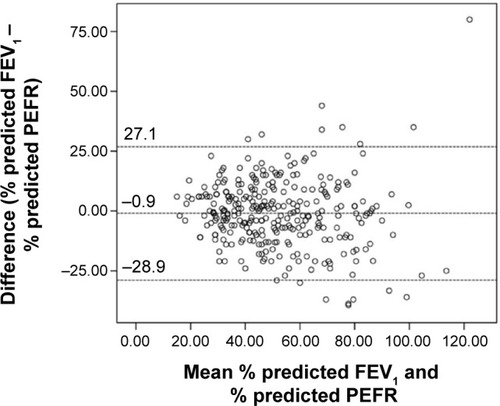
Table 3 Concordance between categorization of severity of airflow limitation based on % predicted FEV1 and % predicted PEFR in COPD patients