Figures & data
Figure 1 Sonographic measurement of the up- and downward movement of the lung silhouette – here on the right side.
Notes: The patient is sitting; the transducer is placed at the lowest point of the lung silhouette in the scapular line. While the patient breathes as deeply as possible a video sequence is performed. Afterward the distance between maximal inspiration and maximal expiration can be measured.
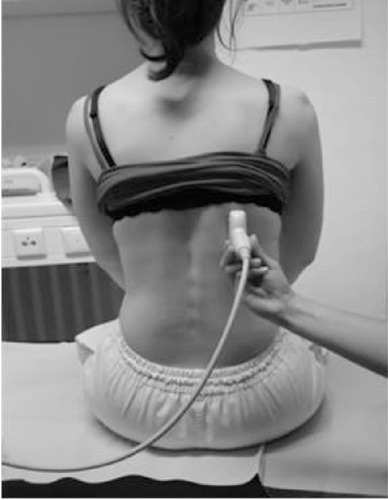
Figure 2 Sonografic measurement of the maximum lung movement.
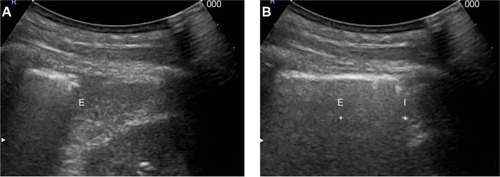
Figure 3 Correlation of both sonographic measurements of diaphragmatic movement of the right hemidiaphragm.
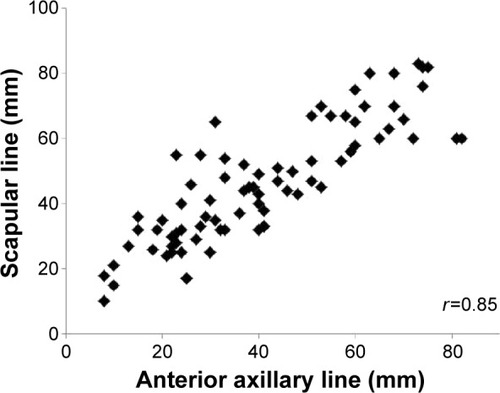
Table 1 Diaphragmatic movement measured using the lung silhouette method and the anterior method in the different patient groups
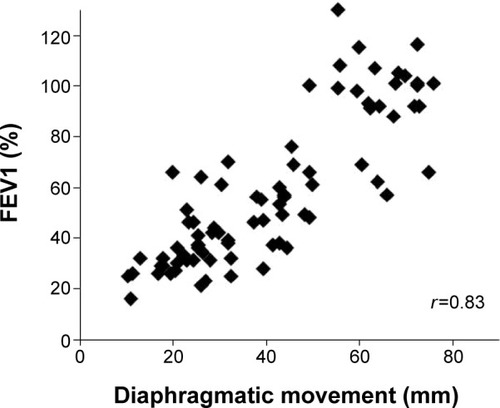
Figure 4 Correlation of diaphragmatic movement and FEV1 in COPD patients and healthy volunteers.
Abbreviations: FEV1, forced expiratory volume in the first second; COPD, chronic obstructive pulmonary disease.