Figures & data
Figure 1 Receiver operating characteristic curve illustrating that blood eosinophils are a marker of sputum eosinophil-associated exacerbations.
Abbreviations: IL, interleukin; CCL, chemokine ligand; TNF, tumor necrosis factor; VCAM, vascular cell adhesion molecule.
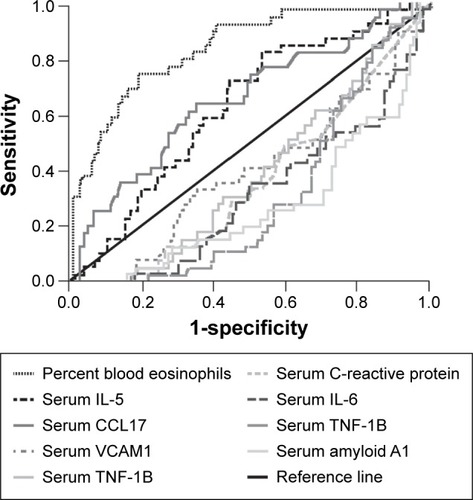
Table 1 Symptomatic components of an exacerbation, evaluated using the EXAcerbation of COPD Tool (EXACT)Citation17
Figure 2 EXAcerbations of COPD Tool (EXACT) scores for reported (identified by health care resource utilization and by EXACT) and unreported (identified by EXACT only) exacerbations.Citation1
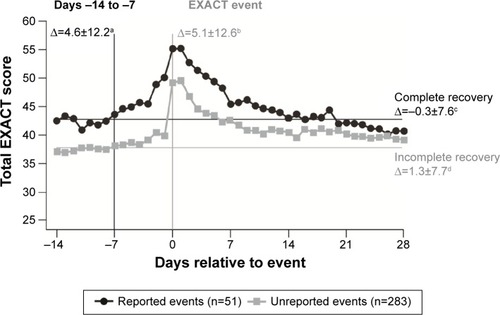
Figure 3 Natural history of COPD in a cohort of 73,106 patients after first hospitalization for a severe exacerbation, showing (A) rate of next severe exacerbation and (B) rate of next severe exacerbation or death per 10,000 patients per day.Citation3
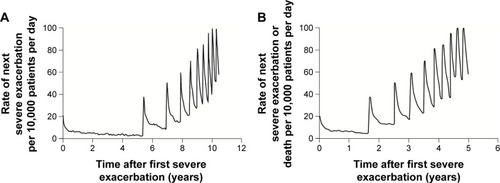
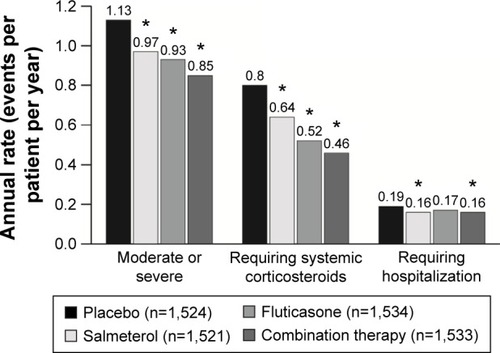
Figure 4 Annual rate of exacerbations, systemic corticosteroid prescriptions, and hospitalizations in a randomized, placebo-controlled trial of combination therapy with a long-acting β-agonist and inhaled corticosteroid in patients with COPD.