
Figures & data
Figure 1 Study design: 4-week, randomized, double-blind, placebo-controlled, parallel-group study.
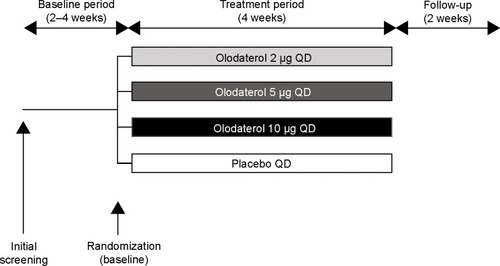
Table 1 Patient demographics and baseline characteristics
Figure 2 CONSORT diagram illustrating participant flow.
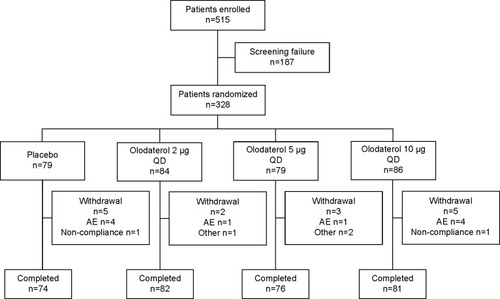
Table 2 Adjusted mean trough FEV1 after 4 weeks of treatment
Figure 3 Adjusted mean trough FEV1 (A) and FVC (B) responses (± standard error) at Weeks 1, 2, and 4 of olodaterol and placebo treatment.
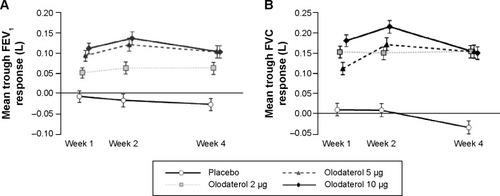
Table 3 Adjusted mean peak FEV1 and FEV1 AUC0–3 after 4 weeks of treatment
Table 4 Adjusted mean trough FVC, peak FVC, and FVC AUC0–3 after 4 weeks of treatment
Figure 4 Mean FEV1 (A and B) and FVC (C and D) responses from −10 minutes to 3 hours on Day 1 (first administration) and Week 4.
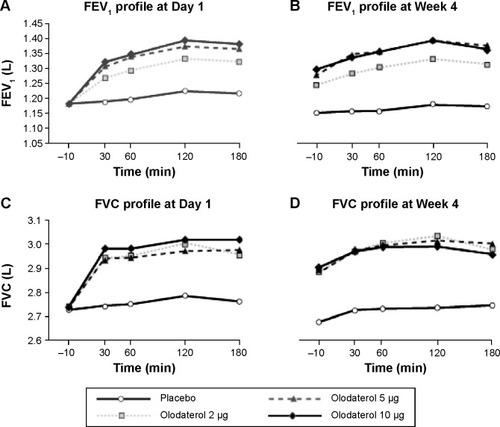
Table 5 Pharmacokinetic parameters of olodaterol following first administration
Table 6 Pharmacokinetic parameters of olodaterol following last administration
Figure 5 Mean plasma concentration–time profiles for olodaterol.
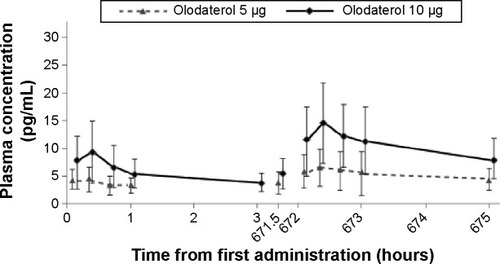
Figure 6 Dose-normalized steady-state maximum concentrations (A) and AUC0–1 (B) of olodaterol.
Abbreviations: gMean, geometric mean; Cmax,ss,norm, maximum measured concentration of olodaterol in plasma, steady-state, dose-normalized; AUC0–1,ss,norm, area under the curve from 0 hour to 1 hour, steady-state, dose-normalized.
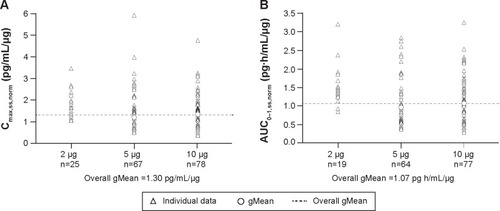
Table 7 Summary of AEs under treatmentTable Footnotea