Figures & data
Figure 1 Study designs of (A) the retrospective control study and (B) the prospective observational study.
Abbreviations: COPD, chronic obstructive pulmonary disease; CPET, cardiopulmonary exercise testing; GOLD, Global Initiative for Chronic Obstructive Lung Disease; MRC, Medical Research Council; PPR-OT, personalized patient-specific pulmonary rehabilitation-occupational therapy; HOT, home oxygen therapy.
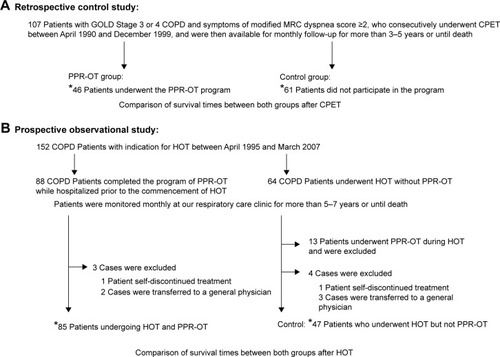
Figure 2 Determination of a safe range using partial pressure of arterial oxygen (PaO2), NE, and the Borg scale during CPET.
Abbreviations: CPET, cardiopulmonary exercise testing; NE, norepinephrine; NT, norepinephrine threshold; PaO2, partial pressure of arterial oxygen.
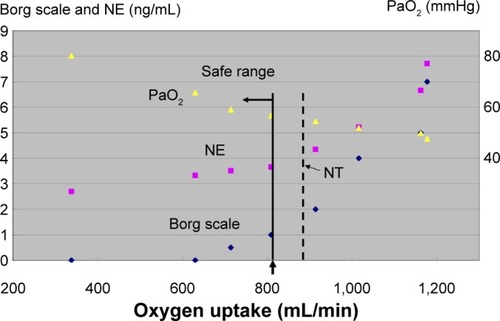
Table 1 Comparison of descriptive characteristics and peak CPET variables in 107 patients with COPD in the retrospective study
Table 2 Univariate and multivariate analyses of descriptive characteristics and peak CPET variables associated with mortality from any cause in the retrospective study
Table 3 Comparison of the cause of death between patients in the PPR-OT and control groups in the retrospective control study
Figure 3 Effect of the personalized pulmonary rehabilitation program that included occupational therapy (PPR-OT) on the 5-year survival (all-cause mortality) of patients with COPD after CPET in the retrospective study.
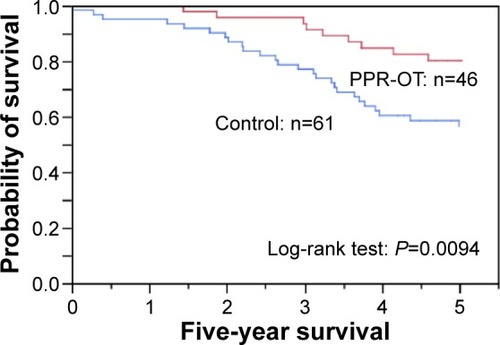
Table 4 Comparison of the descriptive characteristics and management between both groups in the prospective observational study
Table 5 Comparison of the causes of death between the PPR-OT group and the control group in the prospective observational study
Table 6 Univariate and multivariate analyses for management associated with mortality from any cause in 132 patients with COPD of the prospective observational study after HOT
Figure 4 Effect of the personalized pulmonary rehabilitation program that included occupational therapy (PPR-OT) on the 5- to 7-year survival of patients with COPD undergoing HOT in the prospective observational study.
Abbreviations: COPD, chronic obstructive pulmonary disease; PPR-OT, personalized patient-specific pulmonary rehabilitation-occupational therapy; HOT, home oxygen therapy.
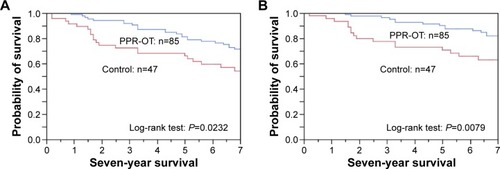
Table 7 Univariate analysis of descriptive characteristics, management, and peak CPET variables associated with mortality from any cause in 85 patients with COPD with PPR-OT after CPET
Figure 5 Effectiveness of the PPR-OT program against the three life-threatening conditions in 85 patients with COPD undergoing HOT.
Abbreviations:
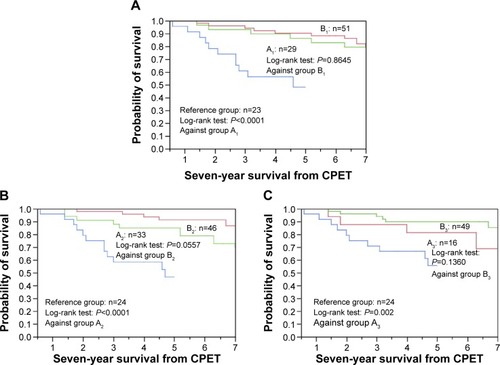
Figure 6 Kaplan–Meier curves of time to death (all-cause mortality) using (A) the Global Initiative for Chronic Obstructive Lung Disease (GOLD) classification, (B) body mass index, and (C) peak
distribution after cardiopulmonary exercise testing (CPET) in 85 patients with chronic obstructive pulmonary disease (COPD) in the personalized patient-specific pulmonary rehabilitation-occupational therapy (PPR-OT) group and comparison with the Reference group (no PPR-OT) in previous report.Citation11
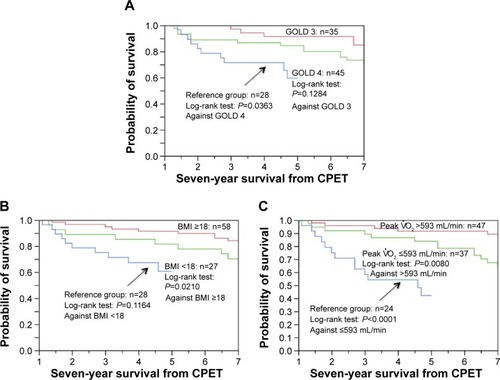
Figure S1 We developed the watch-type pulse oximeter (PULSOX-M24, TEIJIN) in collaboration with Minolta Co. Ltd. The probe is attached to the ring finger, because of ease of pinching.