613
Views
4
CrossRef citations to date
0
Altmetric
Original Research

Distribution of body mass index among subjects with COPD in the Middle East and North Africa region: data from the BREATHE study

, , , &
Pages 1685-1694 | Published online: 26 Aug 2015

Figures & data

Figure 1 Disposition of the study population.

Notes: *COPD subjects fulfilling the COPD epidemiological definition used in the study. Proportions are calculated for each population with respect to the previous line.
Abbreviation: COPD, chronic obstructive pulmonary disease.
Figure 1 Disposition of the study population.

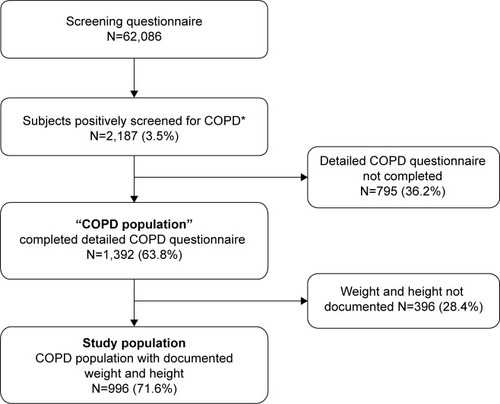
Table 1 Characteristics of the COPD population

Figure 2 Distribution of BMI in COPD population.

Figure 2 Distribution of BMI in COPD population.

Figure 3 Distribution of BMI in COPD population according to each participant country. Green bars: underweight (BMI <20 kg/m2); blue bars: normal weight (BMI 20–25 kg/m2); yellow bars: overweight (BMI 25–30 kg/m2); orange bars: obese (BMI 30–35 kg/m2); red bars: morbidly obese (BMI ≥35 kg/m2). The mean BMI (± SD) is provided above the histograms for each country.

Abbreviations: BMI, body mass index; COPD, chronic obstructive pulmonary disease; SD, standard deviation.
Figure 3 Distribution of BMI in COPD population according to each participant country. Green bars: underweight (BMI <20 kg/m2); blue bars: normal weight (BMI 20–25 kg/m2); yellow bars: overweight (BMI 25–30 kg/m2); orange bars: obese (BMI 30–35 kg/m2); red bars: morbidly obese (BMI ≥35 kg/m2). The mean BMI (± SD) is provided above the histograms for each country.

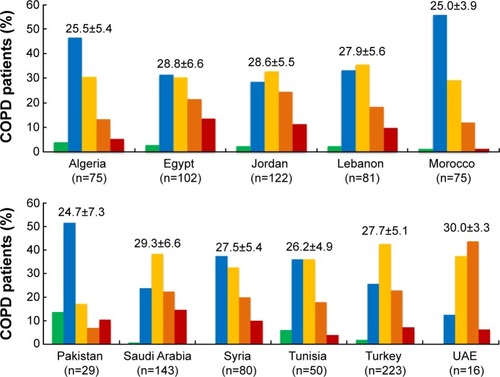
Table 2 Distribution of CAT score classes according to BMI categories in COPD population

Figure 4 Variables associated with CAT scores identified by multiple logistic regression analysis.

Note: Data are presented as Forest diagrams showing odds ratios with 95% confidence intervals.
Abbreviation: CAT, COPD Assessment Test.
Figure 4 Variables associated with CAT scores identified by multiple logistic regression analysis.

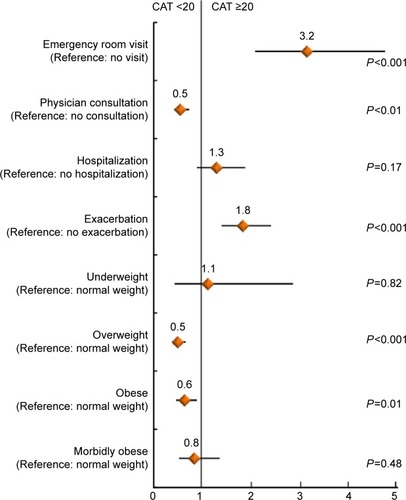
Table 3 Distribution of adapted GOLD severity groups and distribution of comorbidities according to BMI categories